Size Schemes
Size schemes control how the size of features on a map layer is determined — the radius of points in a Point Layer, or the width of lines and arcs in the Line and Arc layers. You can use a single fixed size for every feature, or vary the size based on a data field to create visualizations such as bubble maps.
Size schemes work the same way across all three layer types, so once you learn the options for one layer, you can apply them to the others.
Static vs. Data-Driven Size
Static Size
A static size uses a single, fixed value for every feature in the layer, regardless of any data values.
When to use:
- Showing the location of features without emphasizing a metric
- Keeping a clean, uncluttered map
- Layering data where another layer carries the data-driven styling
Configuration:
- Size: The radius (points) or width (lines, arcs) of every feature
- Units: Whether the size is measured in meters or pixels (see Units)
Data-Driven Size
A data-driven size varies the size of each feature based on the value of a field. Data-driven sizing works with both numeric metrics (using interpolation) and categorical dimensions (using a custom mapping).
Units: Meters vs. Pixels
Sizes can be expressed in either meters or pixels, and the choice affects how features behave as the user zooms.
- Meters: The feature represents a real-world size and scales with the map. A 500-meter point stays 500 meters across as you zoom in and out, so it grows larger on screen as you zoom in. Use meters when the size has a physical meaning (e.g. a coverage radius).
- Pixels: The feature stays a constant size on screen regardless of zoom. Use pixels when you care about visual consistency rather than real-world scale.
Minimum and Maximum Pixels
When using meter units, features can become too small to see when zoomed out, or large enough to overwhelm the map when zoomed in. The Minimum Pixels and Maximum Pixels settings clamp the on-screen size to a range, ensuring features stay visible without dominating the view.
- Minimum Pixels: The smallest a feature can appear on screen, even when zoomed far out.
- Maximum Pixels: The largest a feature can appear on screen, even when zoomed far in.
Data-Driven Size: Quantitative (Numeric Fields)
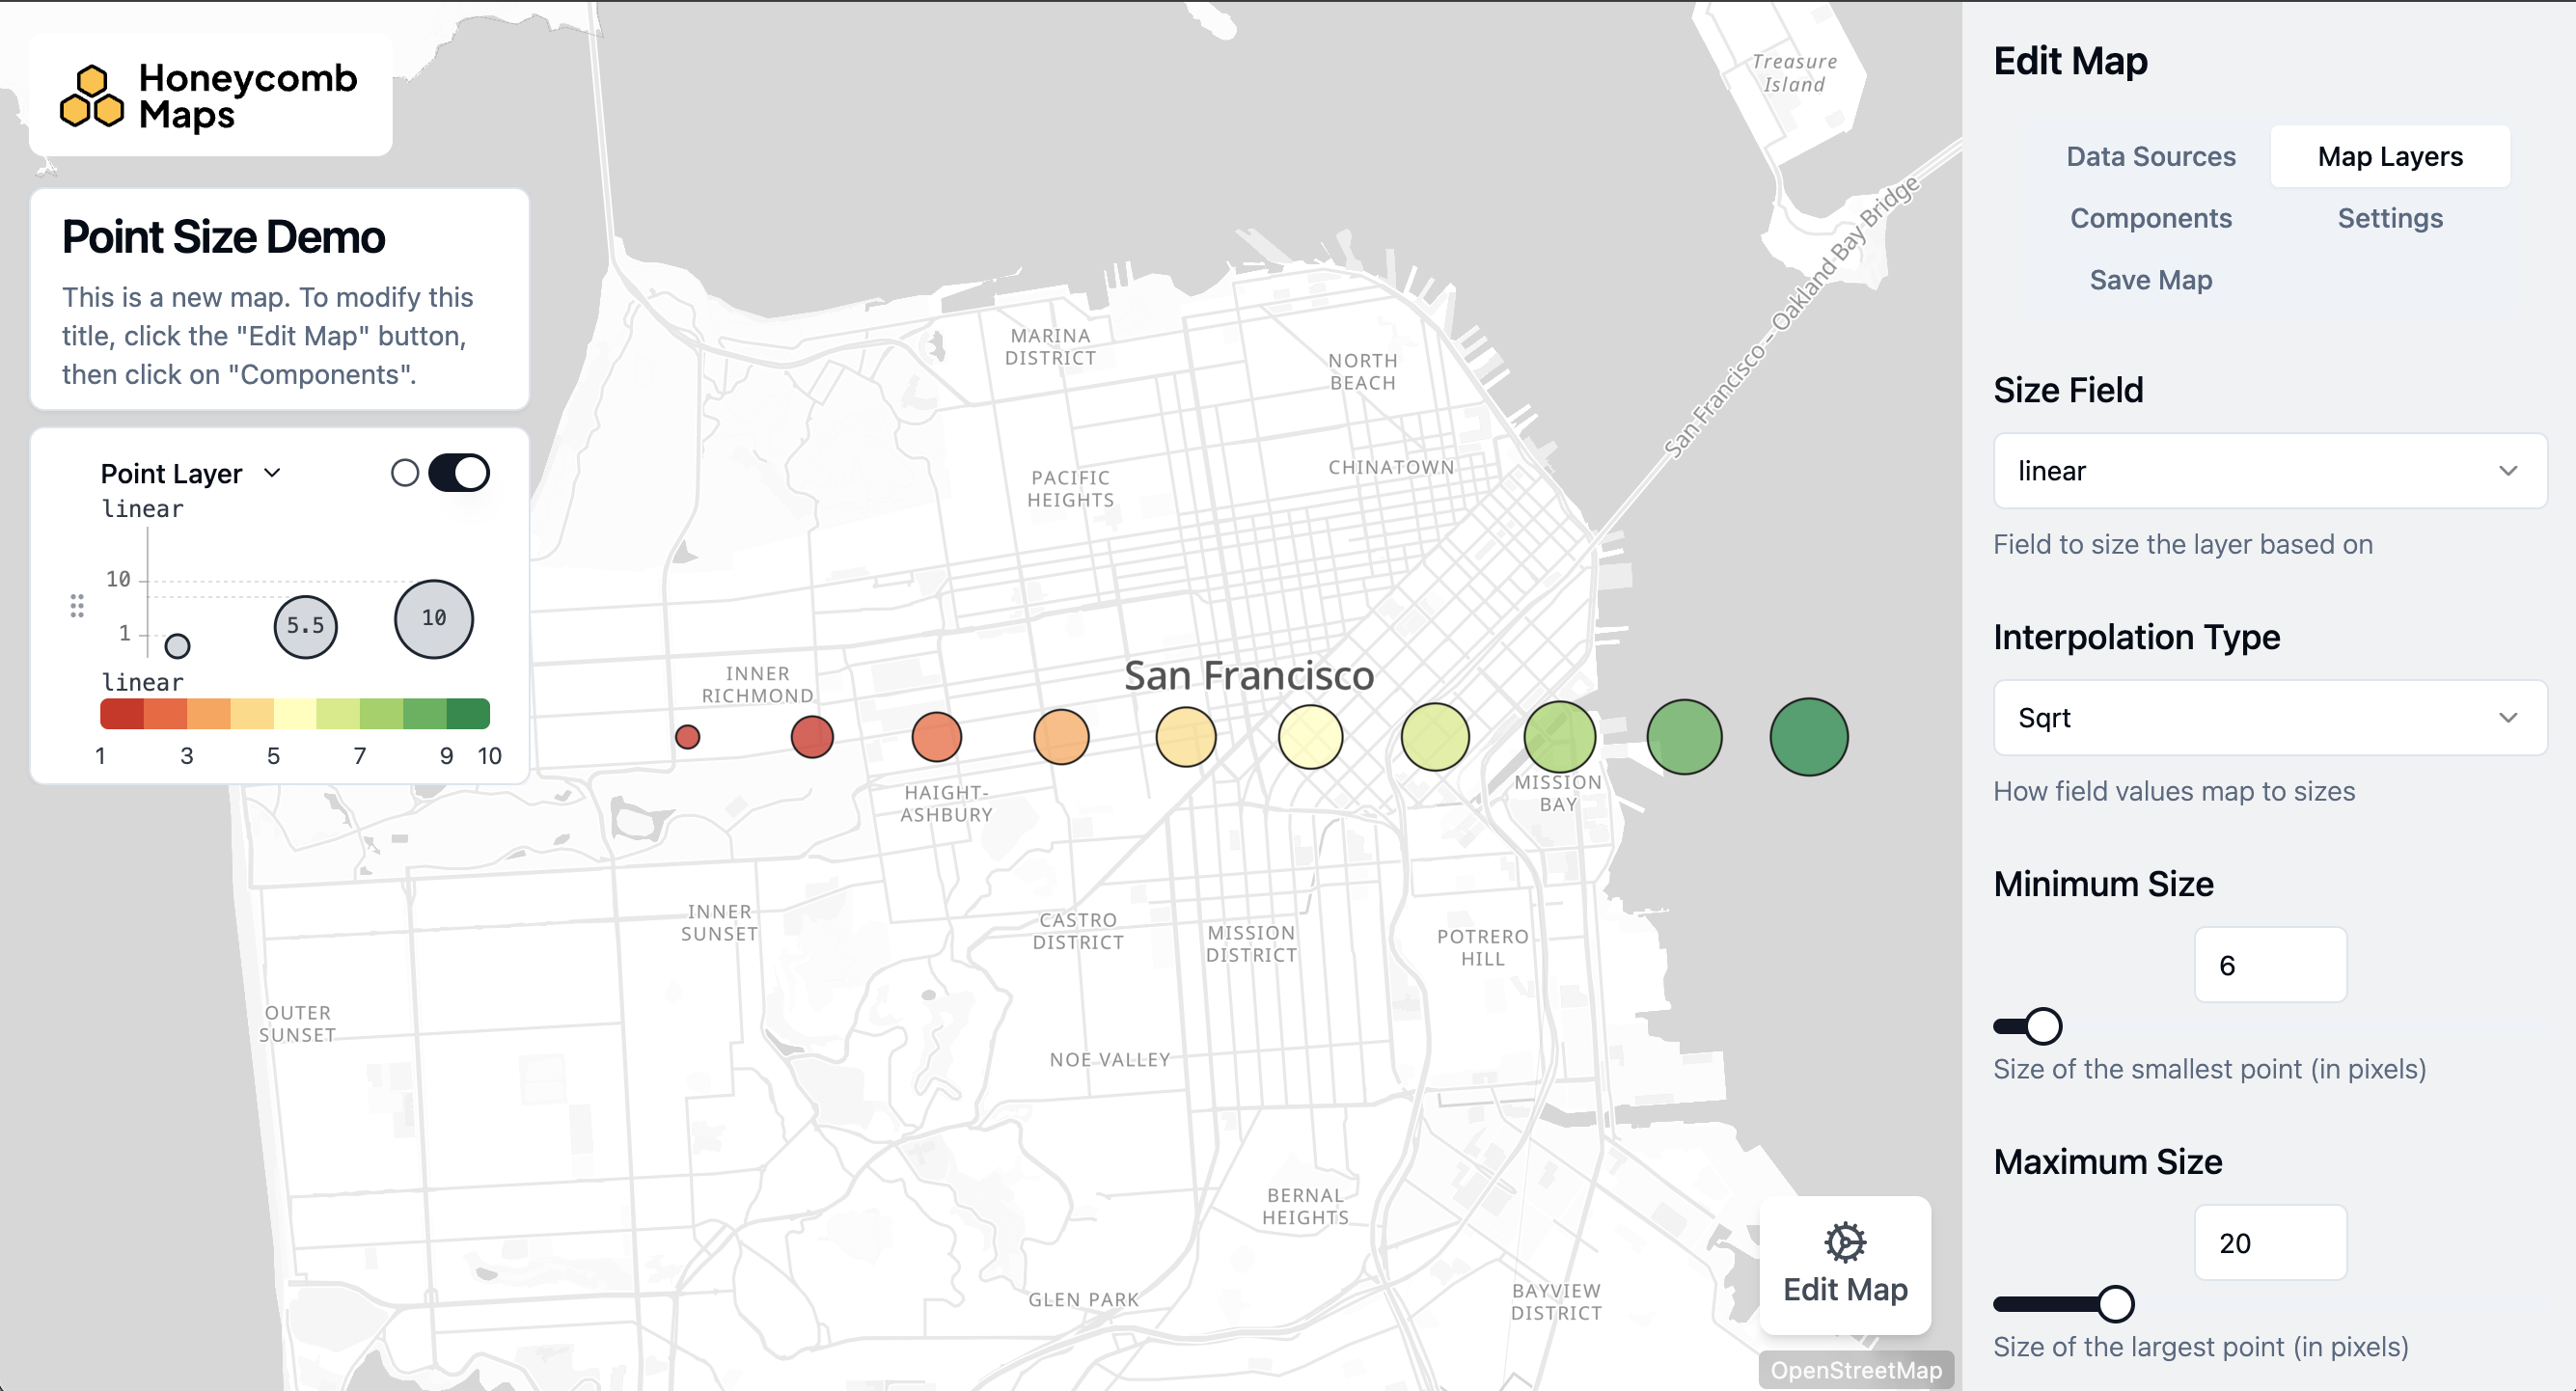
When sizing by a numeric field (a metric such as sales, population, or magnitude), feature size is interpolated between a minimum and maximum size.
Configuration:
- Size Field: The numeric field that drives the size.
- Minimum Size / Maximum Size: The size assigned to the smallest and largest values in the data (in the selected units).
- Reversed: Map smaller values to larger sizes. This is useful when low values are the ones you want to spotlight — for example, drawing attention to locations where a sales metric is lowest.
- Interpolation Type: How values between the minimum and maximum are distributed across the size range:
- Square Root (default): Sizes are scaled so that a feature's area is proportional to the value. This is the recommended option for bubble maps, because people perceive magnitude by area rather than radius.
- Linear: Size is directly proportional to the value.
- Logarithmic: Compresses large values, useful when a few features have much higher values than the rest.
- Custom Discrete: Define your own value ranges and assign a specific size to each range. Each range is inclusive of its start value and exclusive of its end value
[start, end); values outside all ranges receive a default size. This mirrors the Custom Discrete option for color schemes and is useful for keeping sizes stable as filters change the data.
TIP
For bubble maps, prefer Square Root interpolation. Because the human eye reads the area of a circle as its magnitude, scaling radius linearly makes large values look far bigger than they are. Square-root scaling keeps area proportional to the value.
Data-Driven Size: Categorical (Dimension Fields)
When sizing by a categorical field (a dimension such as store type or status), each unique category is mapped to a specific size.
Configuration:
- Size Field: The categorical field that drives the size.
- Size Mapping: Assign a size to each category, along with a default size used for any value not explicitly mapped.
Legend
When a layer uses a data-driven size, Honeycomb automatically adds a size key to the Legend: a series of sized circles for point radius, or a series of varying-thickness lines for line and arc width. The key shows which feature sizes correspond to which data values. For more detail, see the Legend documentation.
Related Documentation
- Point Layer — apply size schemes to point radius
- Line Layer — apply size schemes to line width
- Arc Layer — apply size schemes to arc width
- Color Schemes — the parallel system for coloring features
- Legend — how size keys are displayed