Quickstart
Honeycomb Maps lets you create interactive geospatial visualizations from your data. To get started, choose the platform that matches how you want to use Honeycomb Maps.
The Web App is the easiest to get started with, as you can create an account directly. The Snowflake Native App involves installing Honeycomb into an existing Snowflake account.
1. Create an account
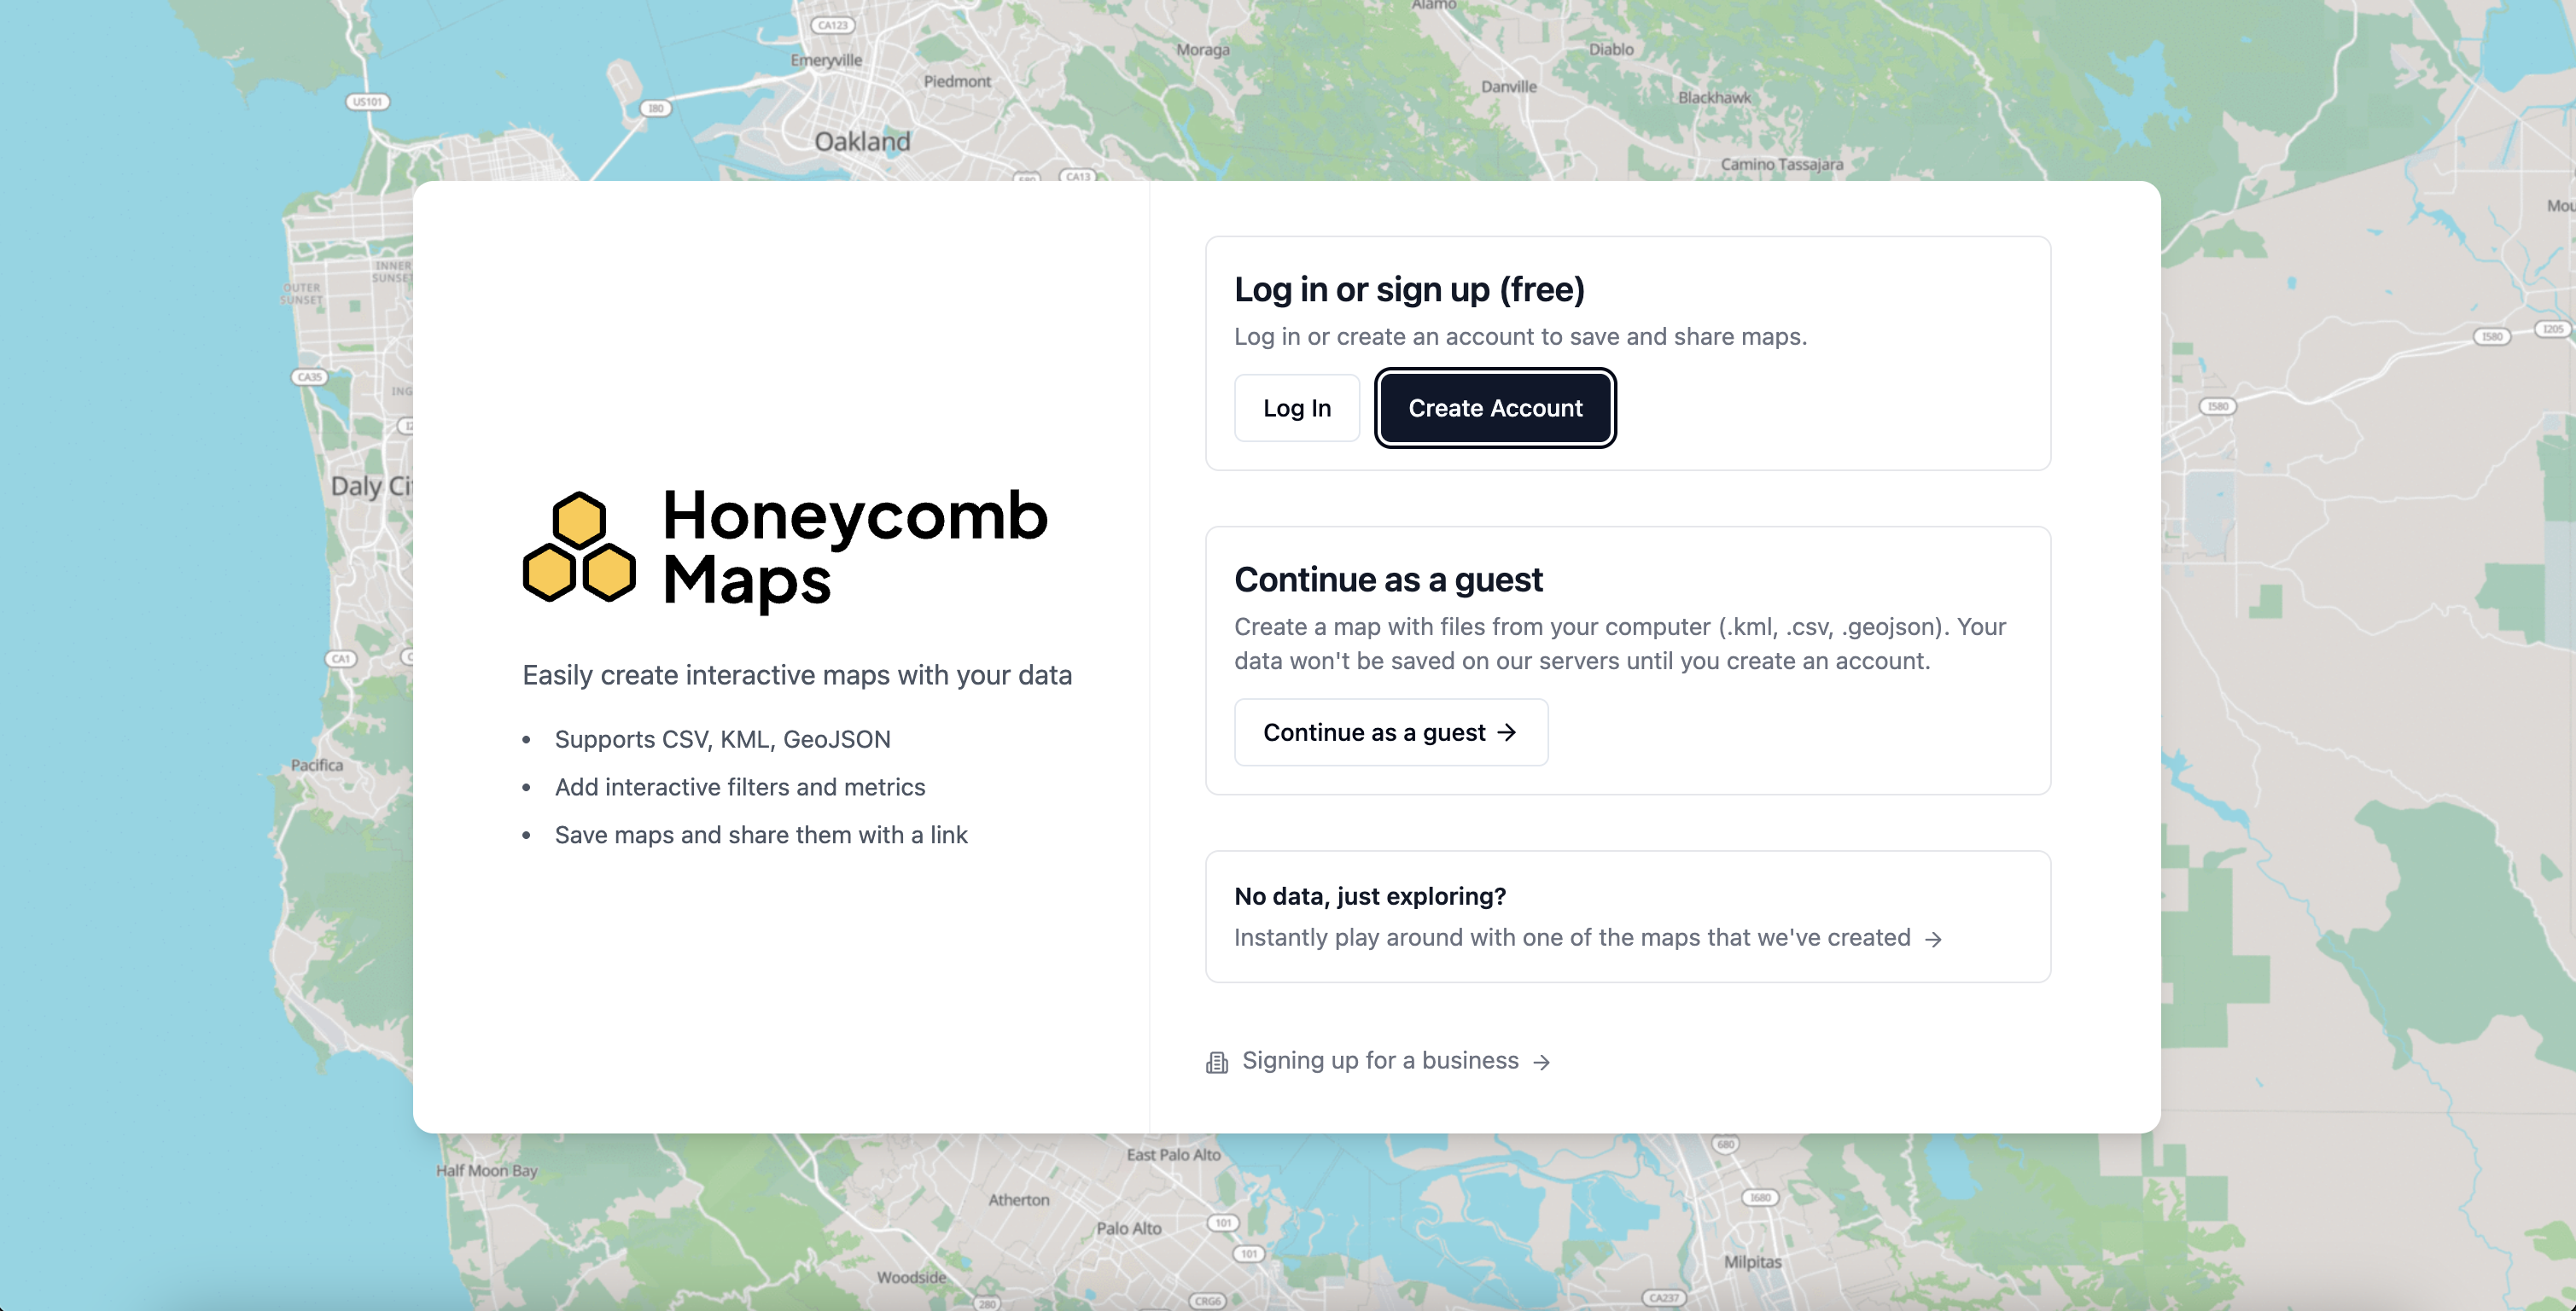
Go to app.honeycombmaps.com and click Create Account to sign up for free.
2. Create a new map
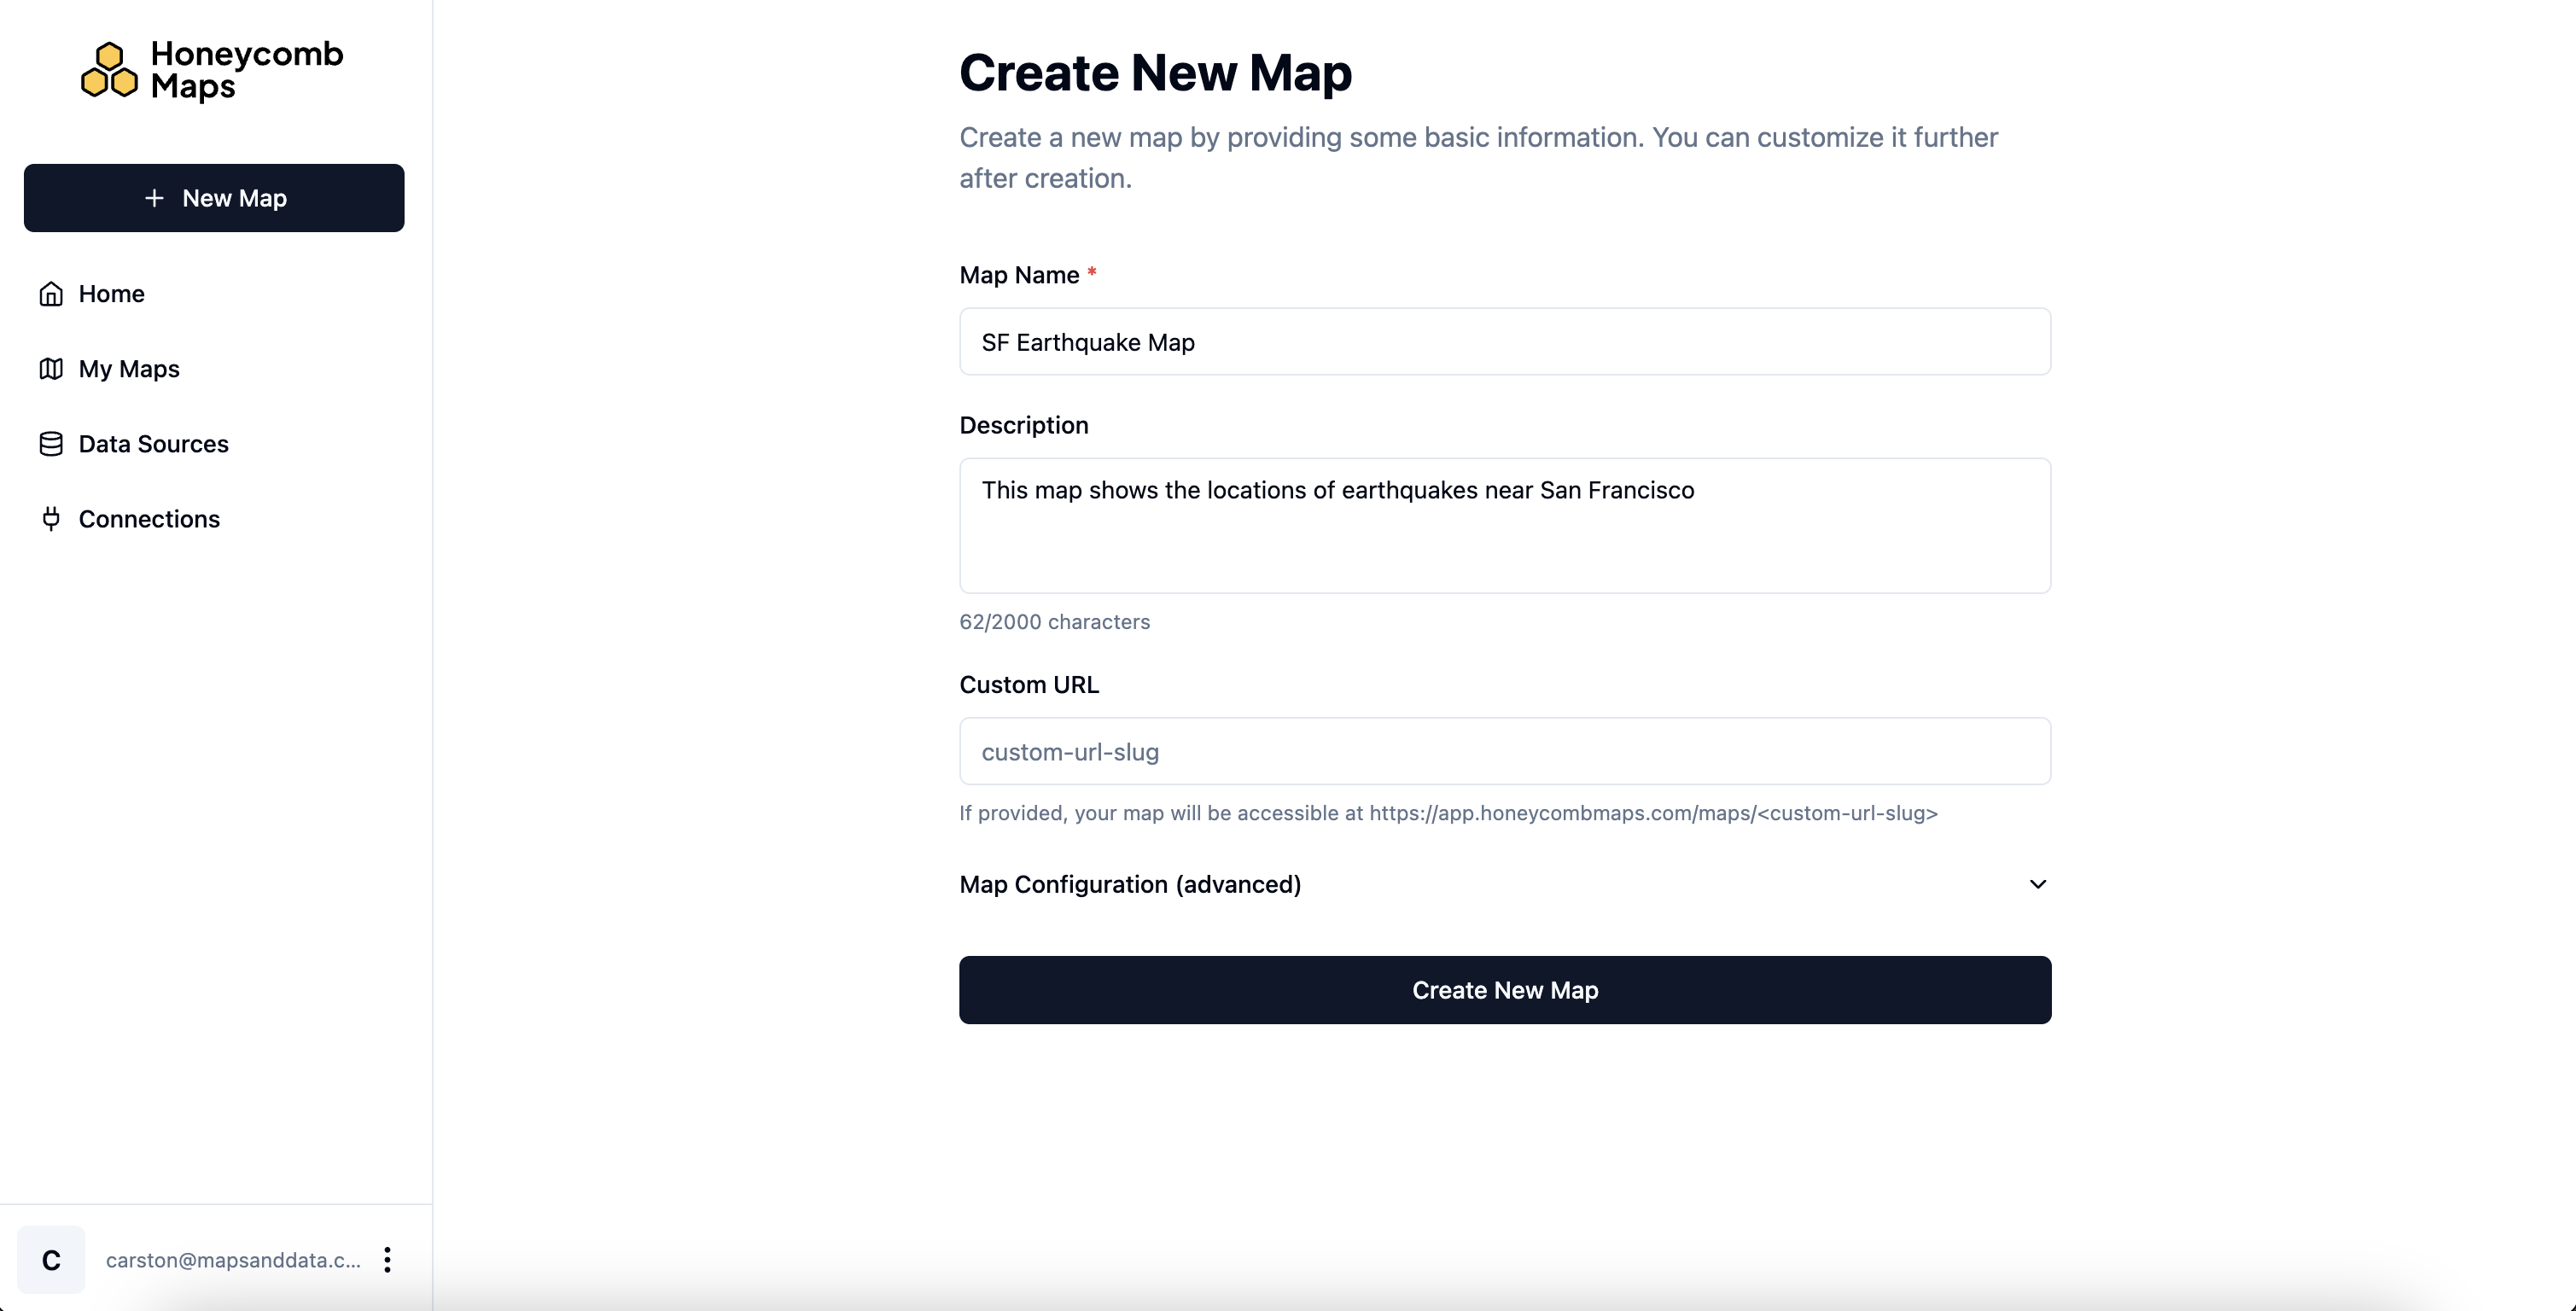
Once logged in, click + New Map, give your map a name and description, and click Create New Map.
3. Add a data source
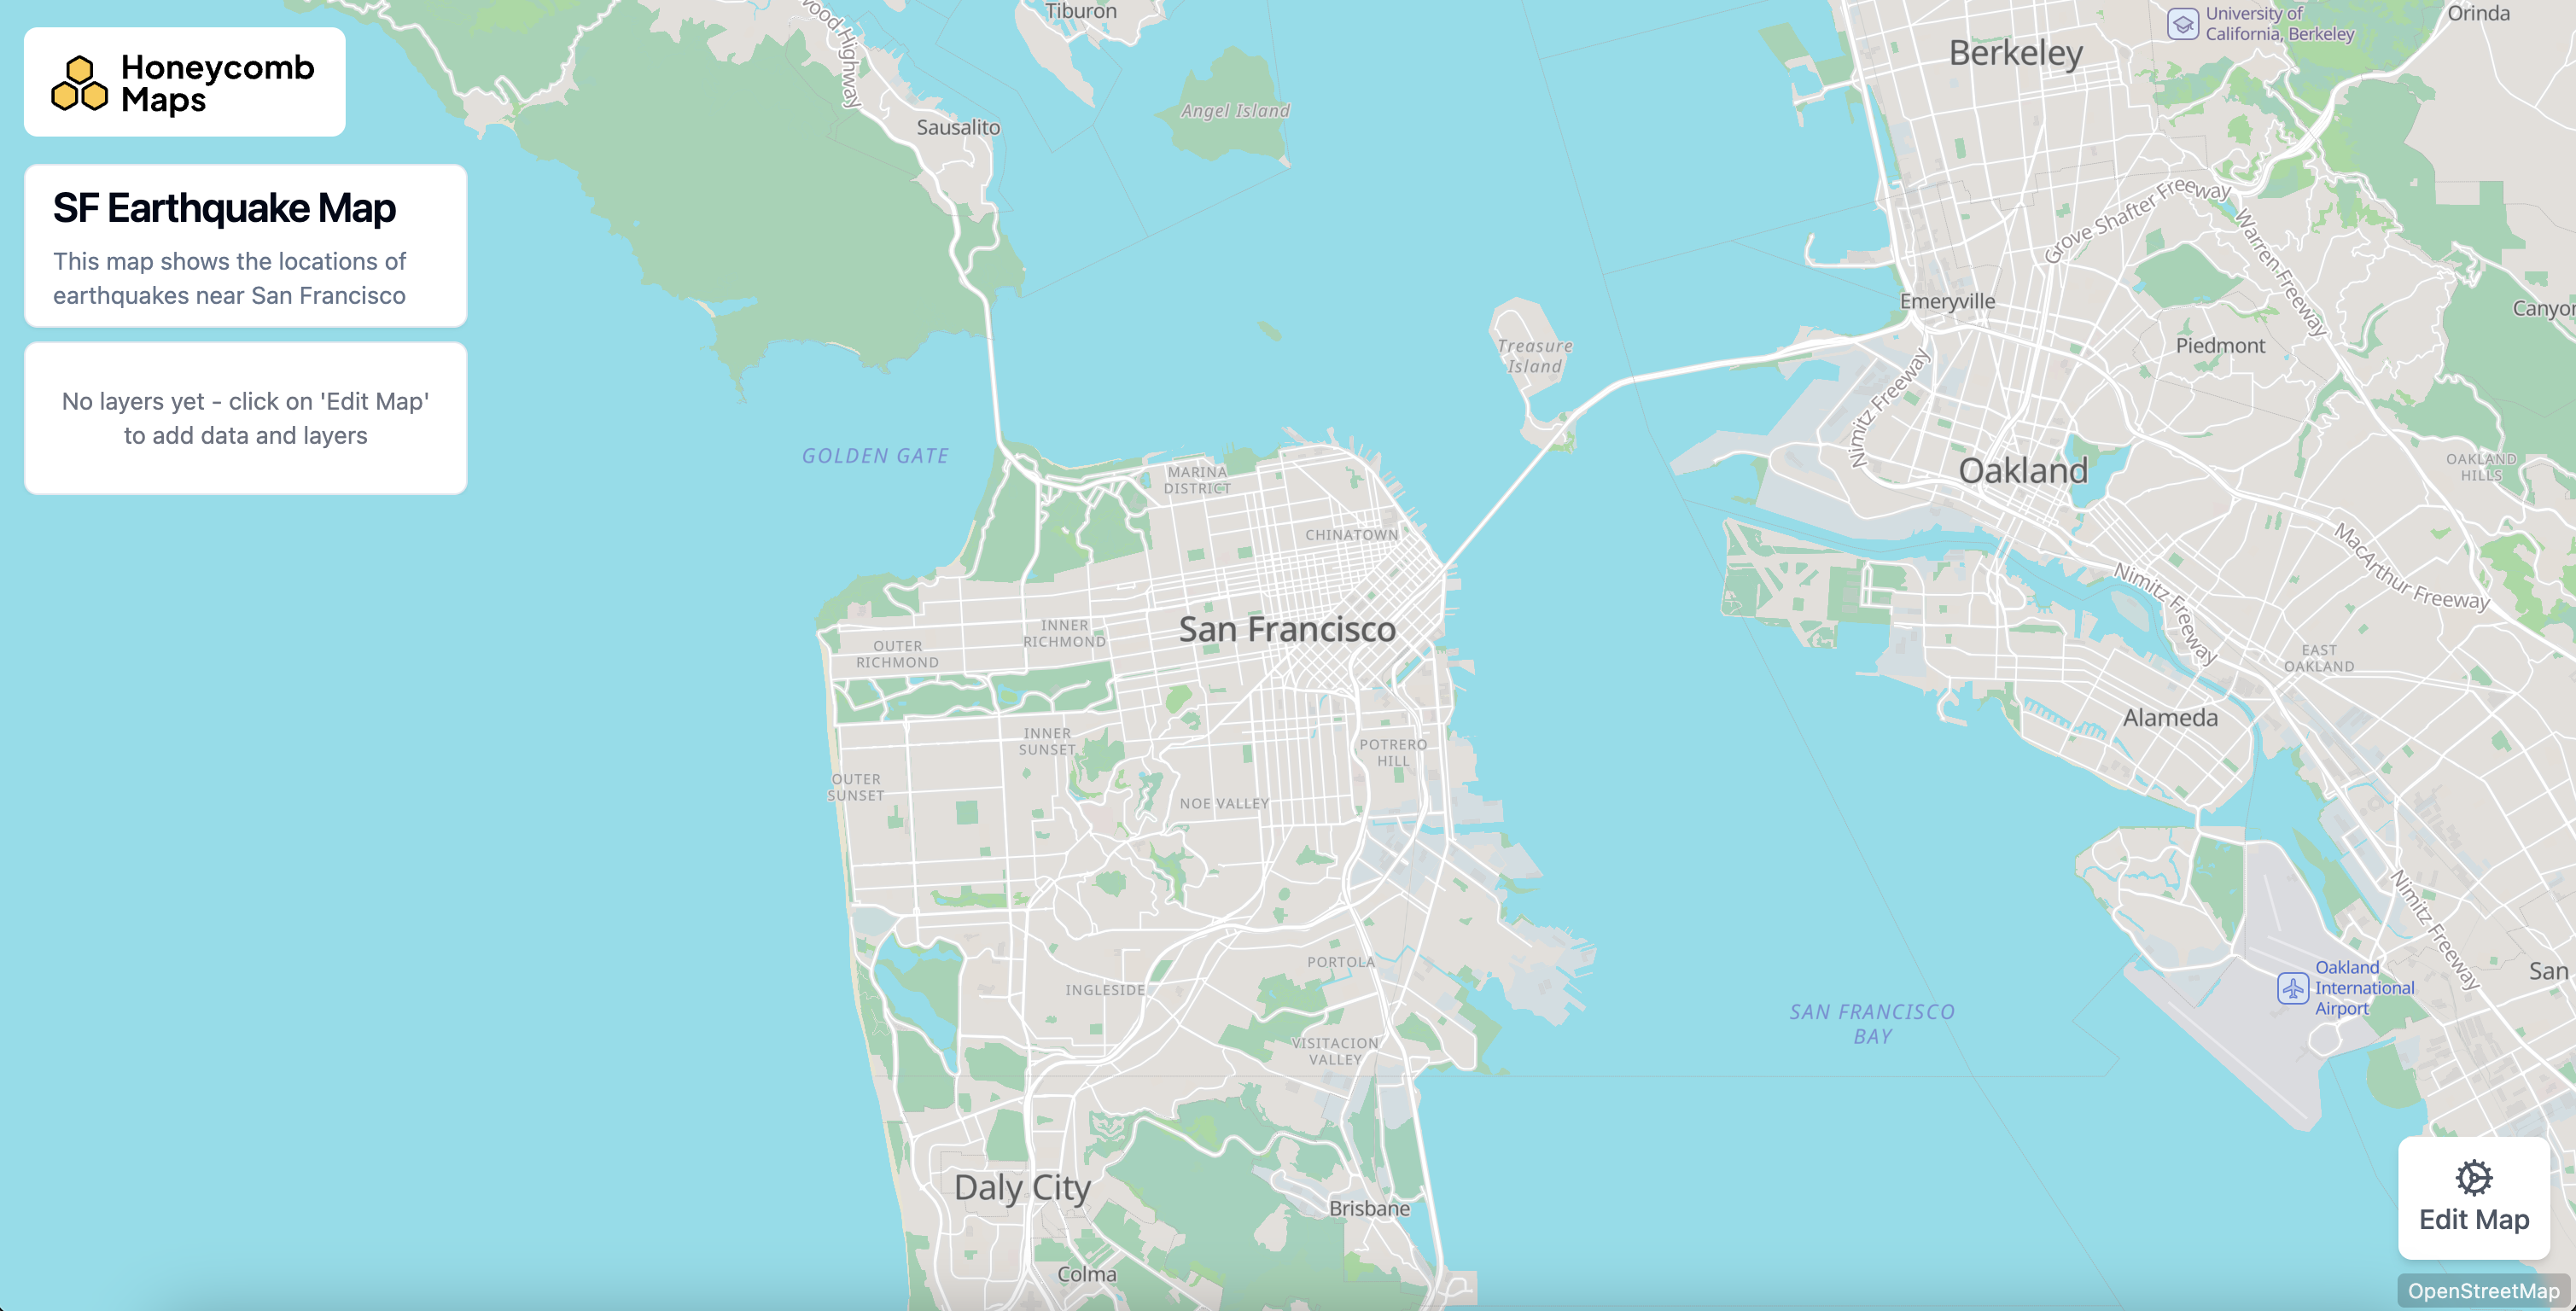
Your new map will load with a blank canvas. Click Edit Map to open the editor.
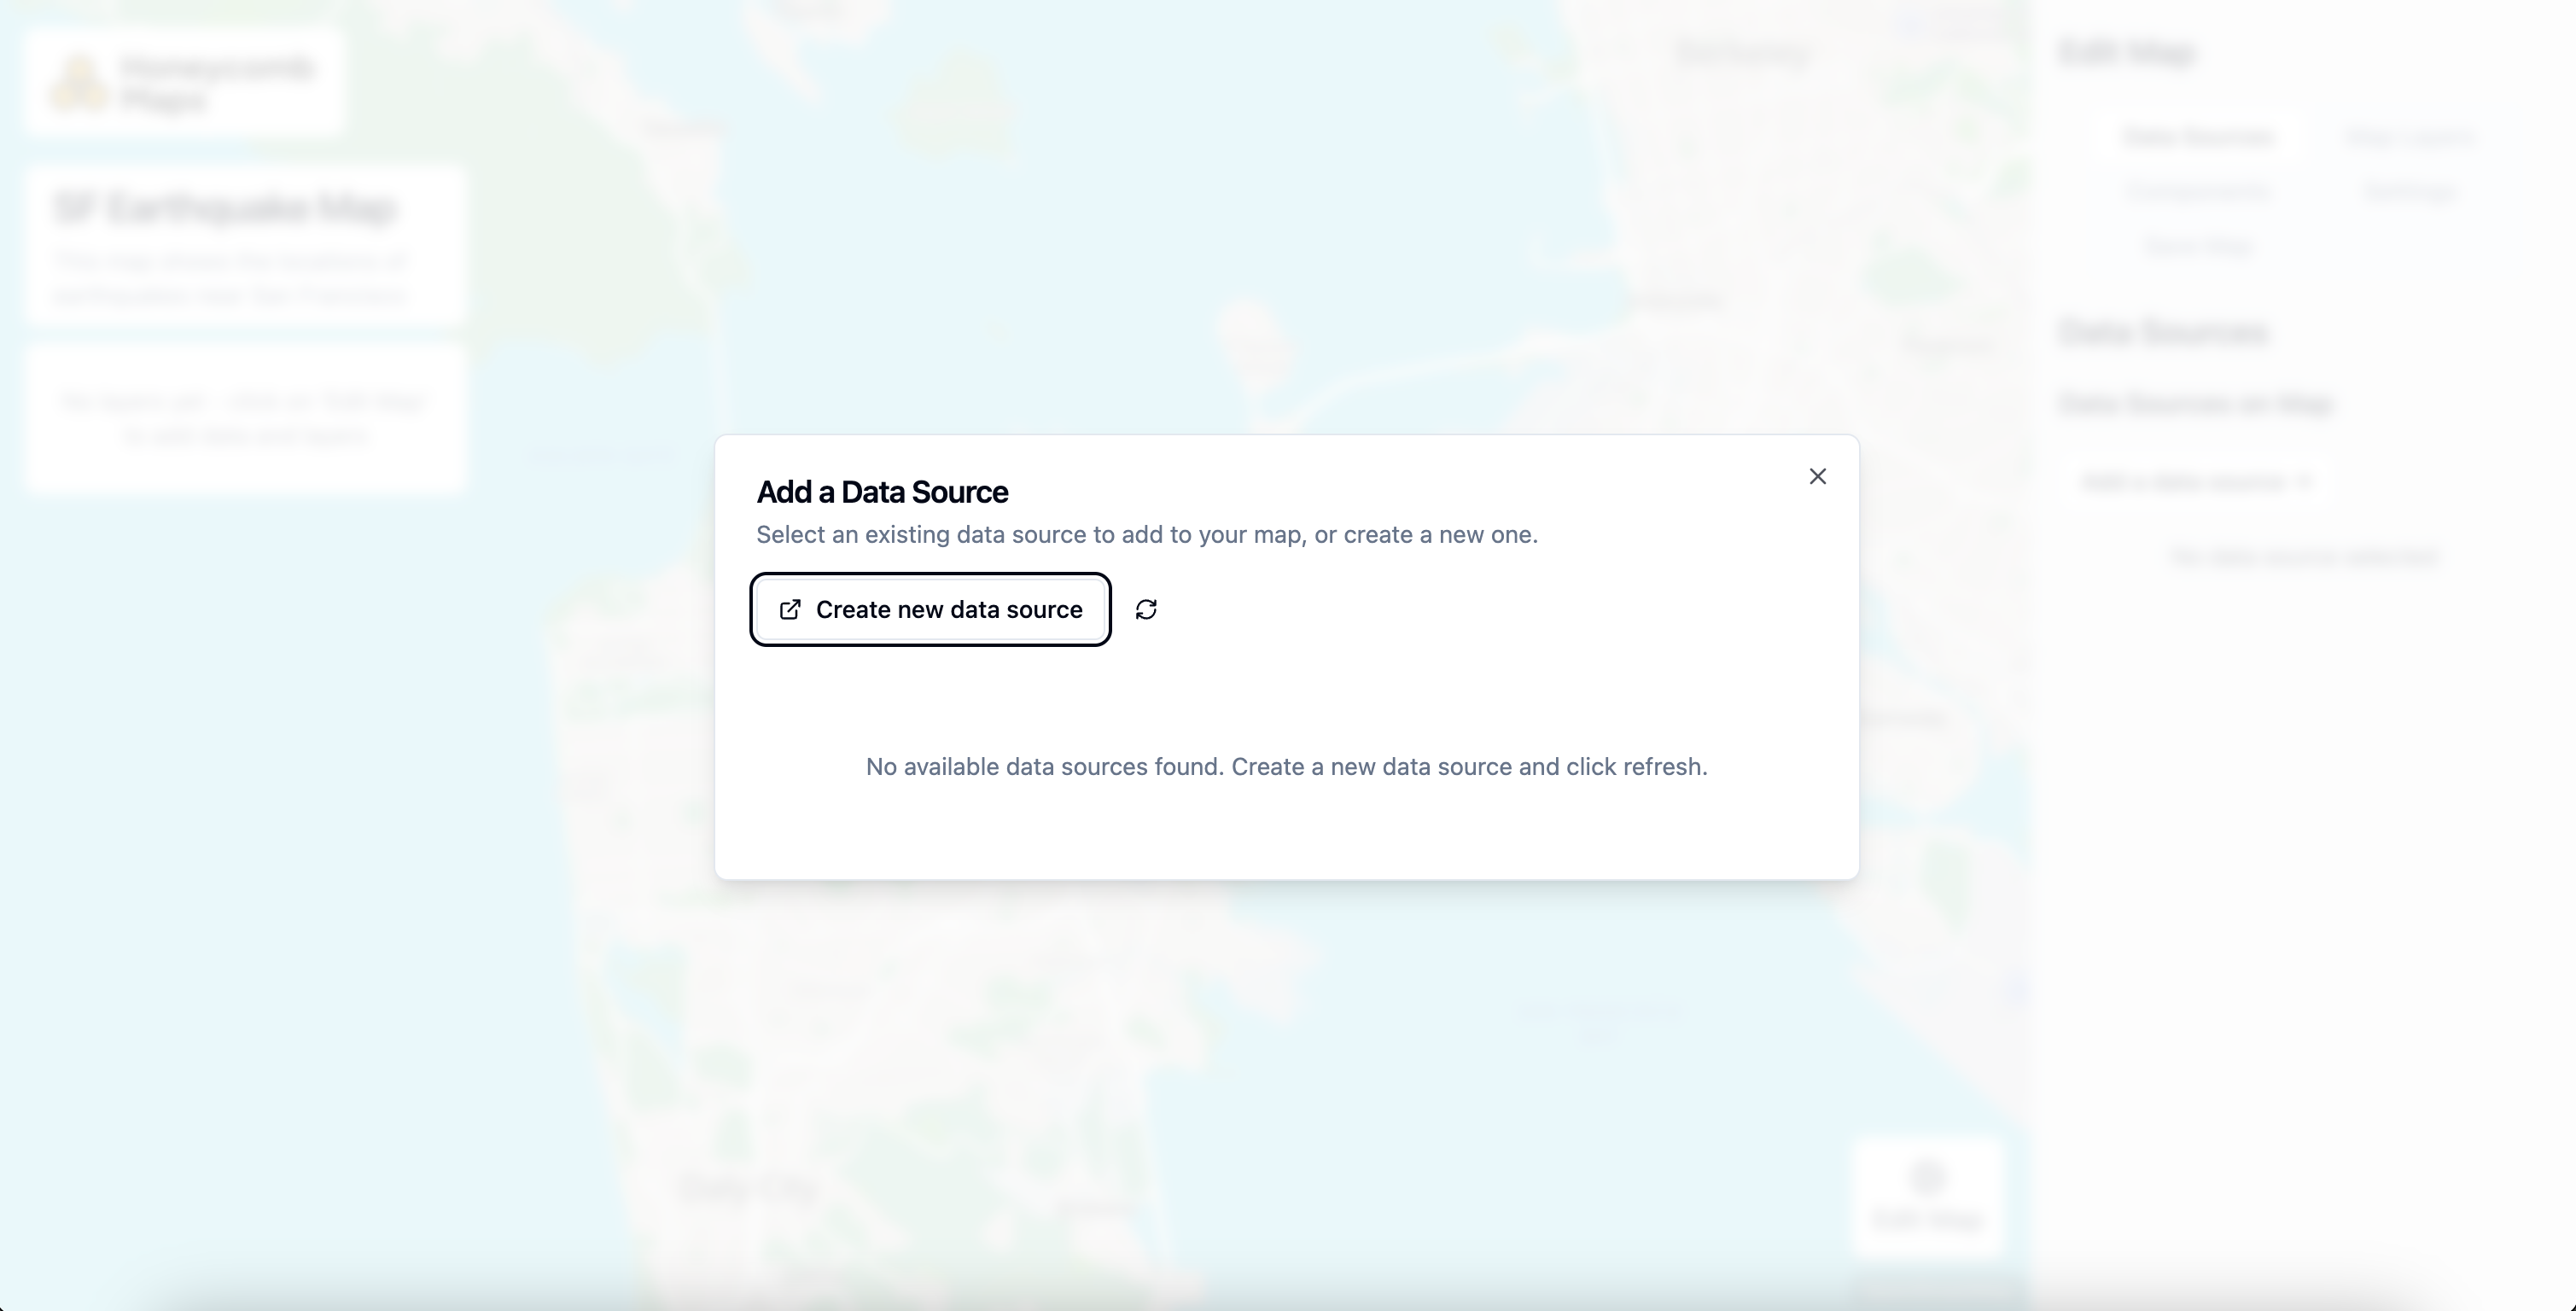
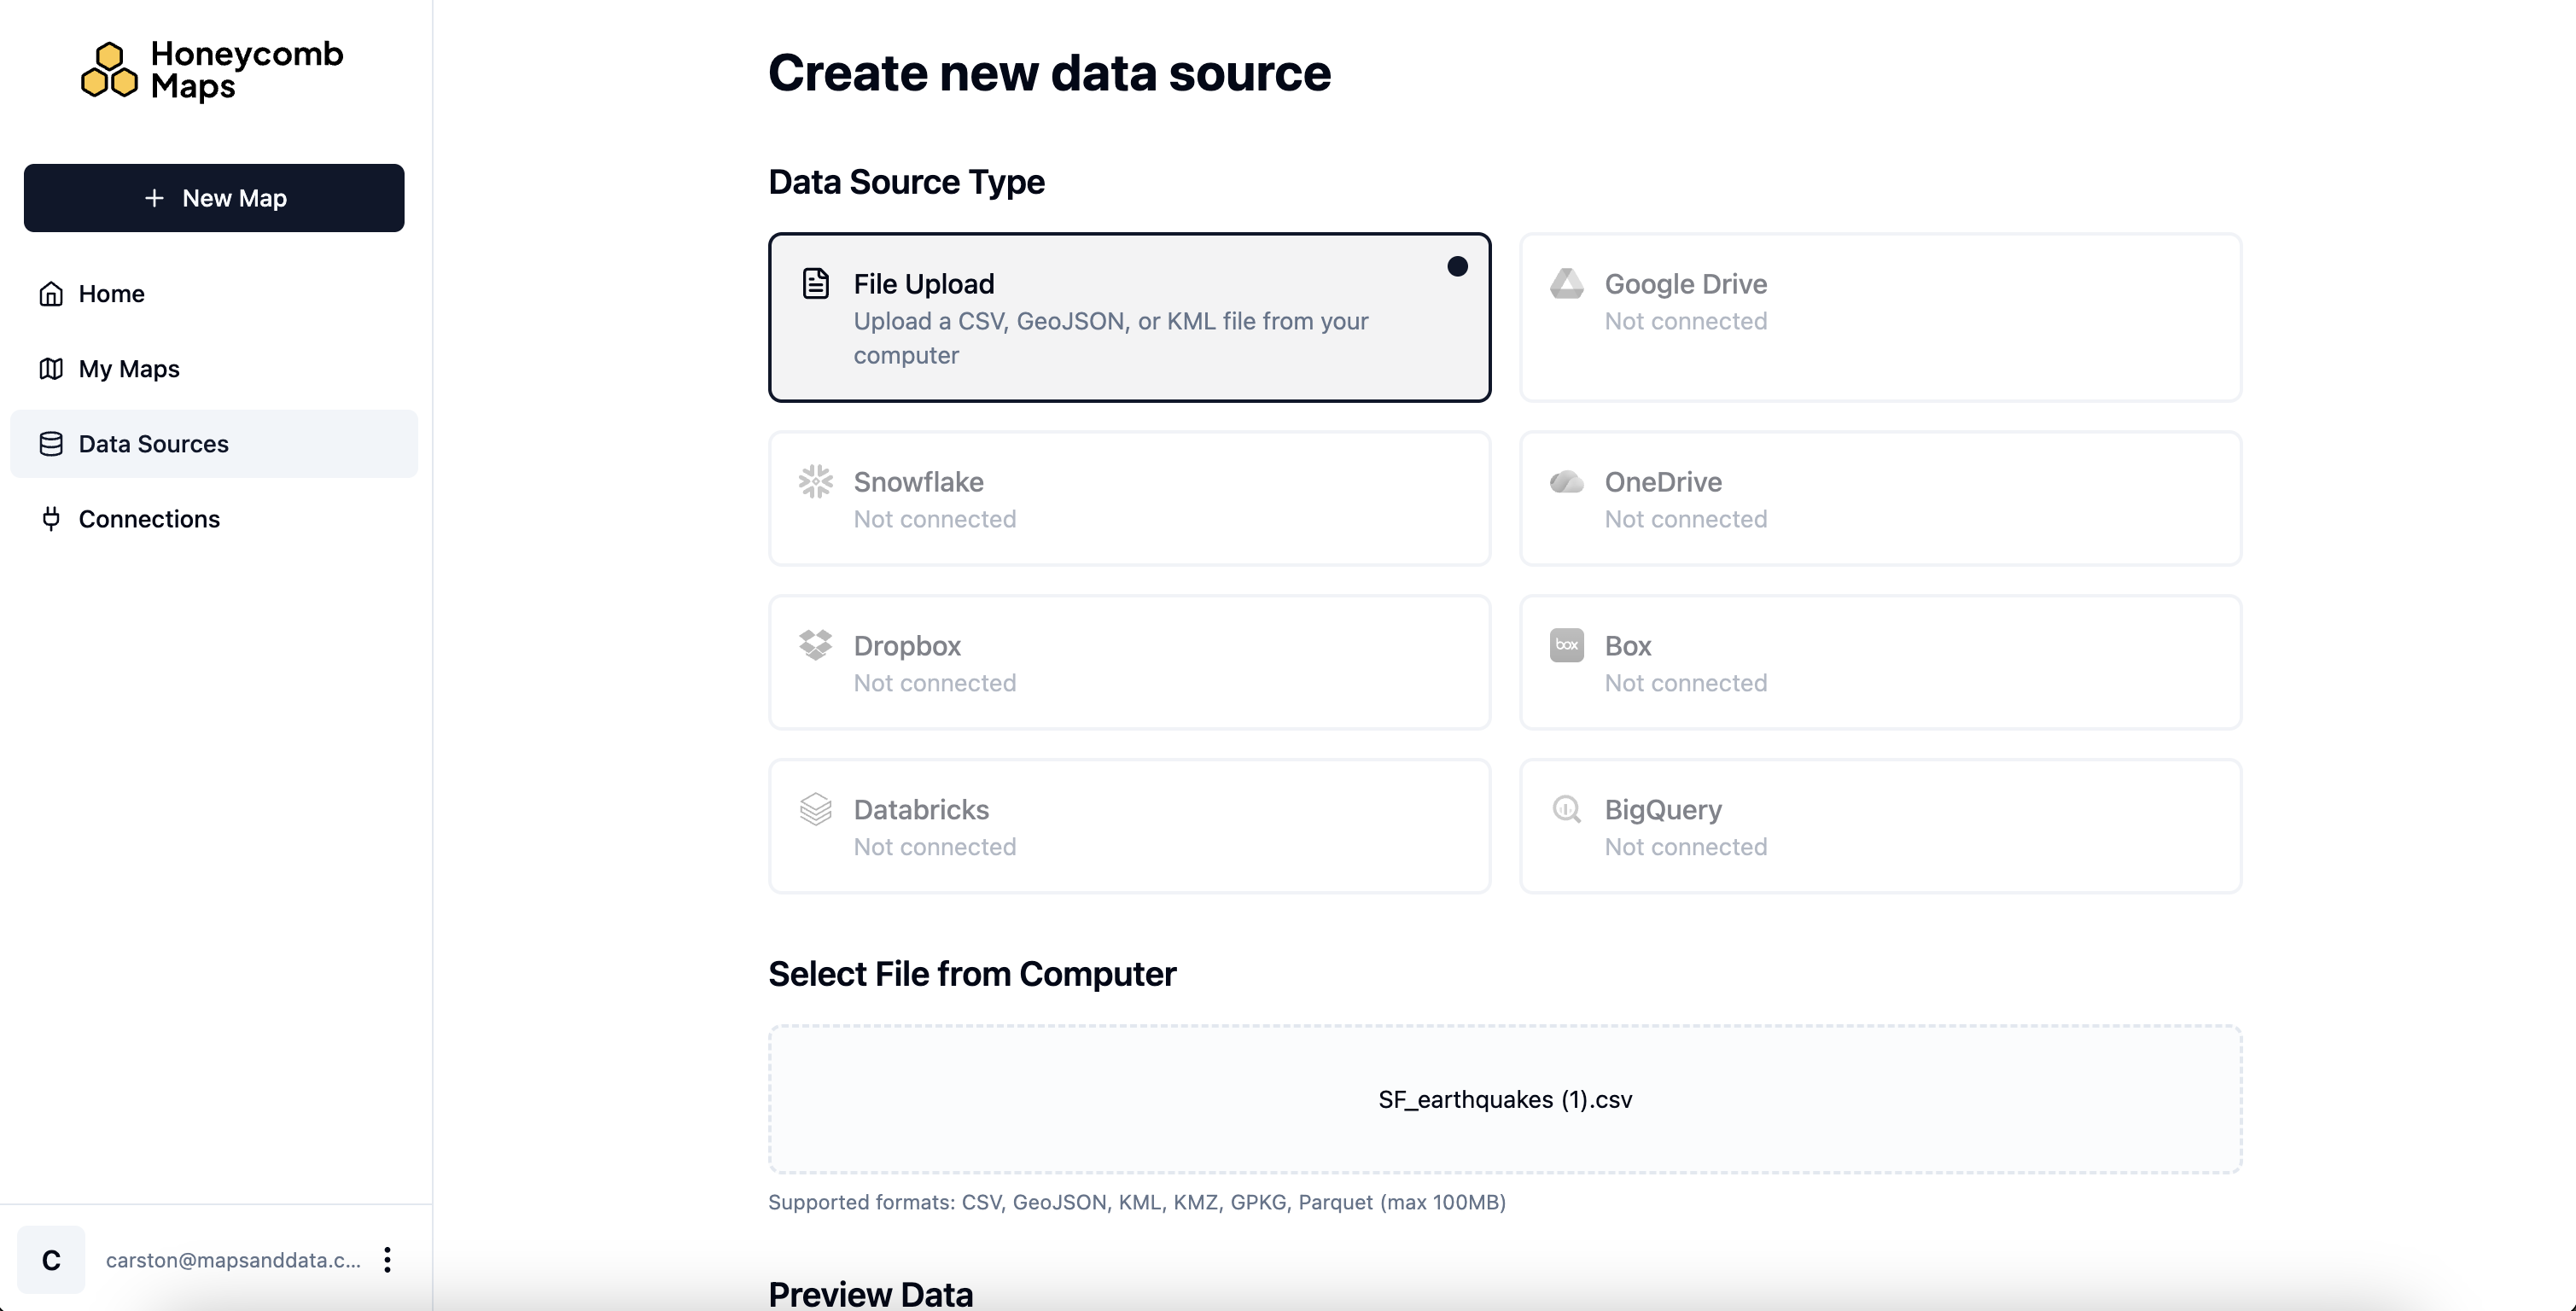
Click Add a Data Source, then Create new data source to connect your data.
Choose a data source type. You can upload a local CSV, GeoJSON, KML, or Parquet file, or connect to Google Drive or other cloud providers. Read this article for tips on structuring your data.
Follow along
To use the same earthquake data shown in this guide, download SF_earthquakes.csv (Source: USGS).
4. Configure map layers
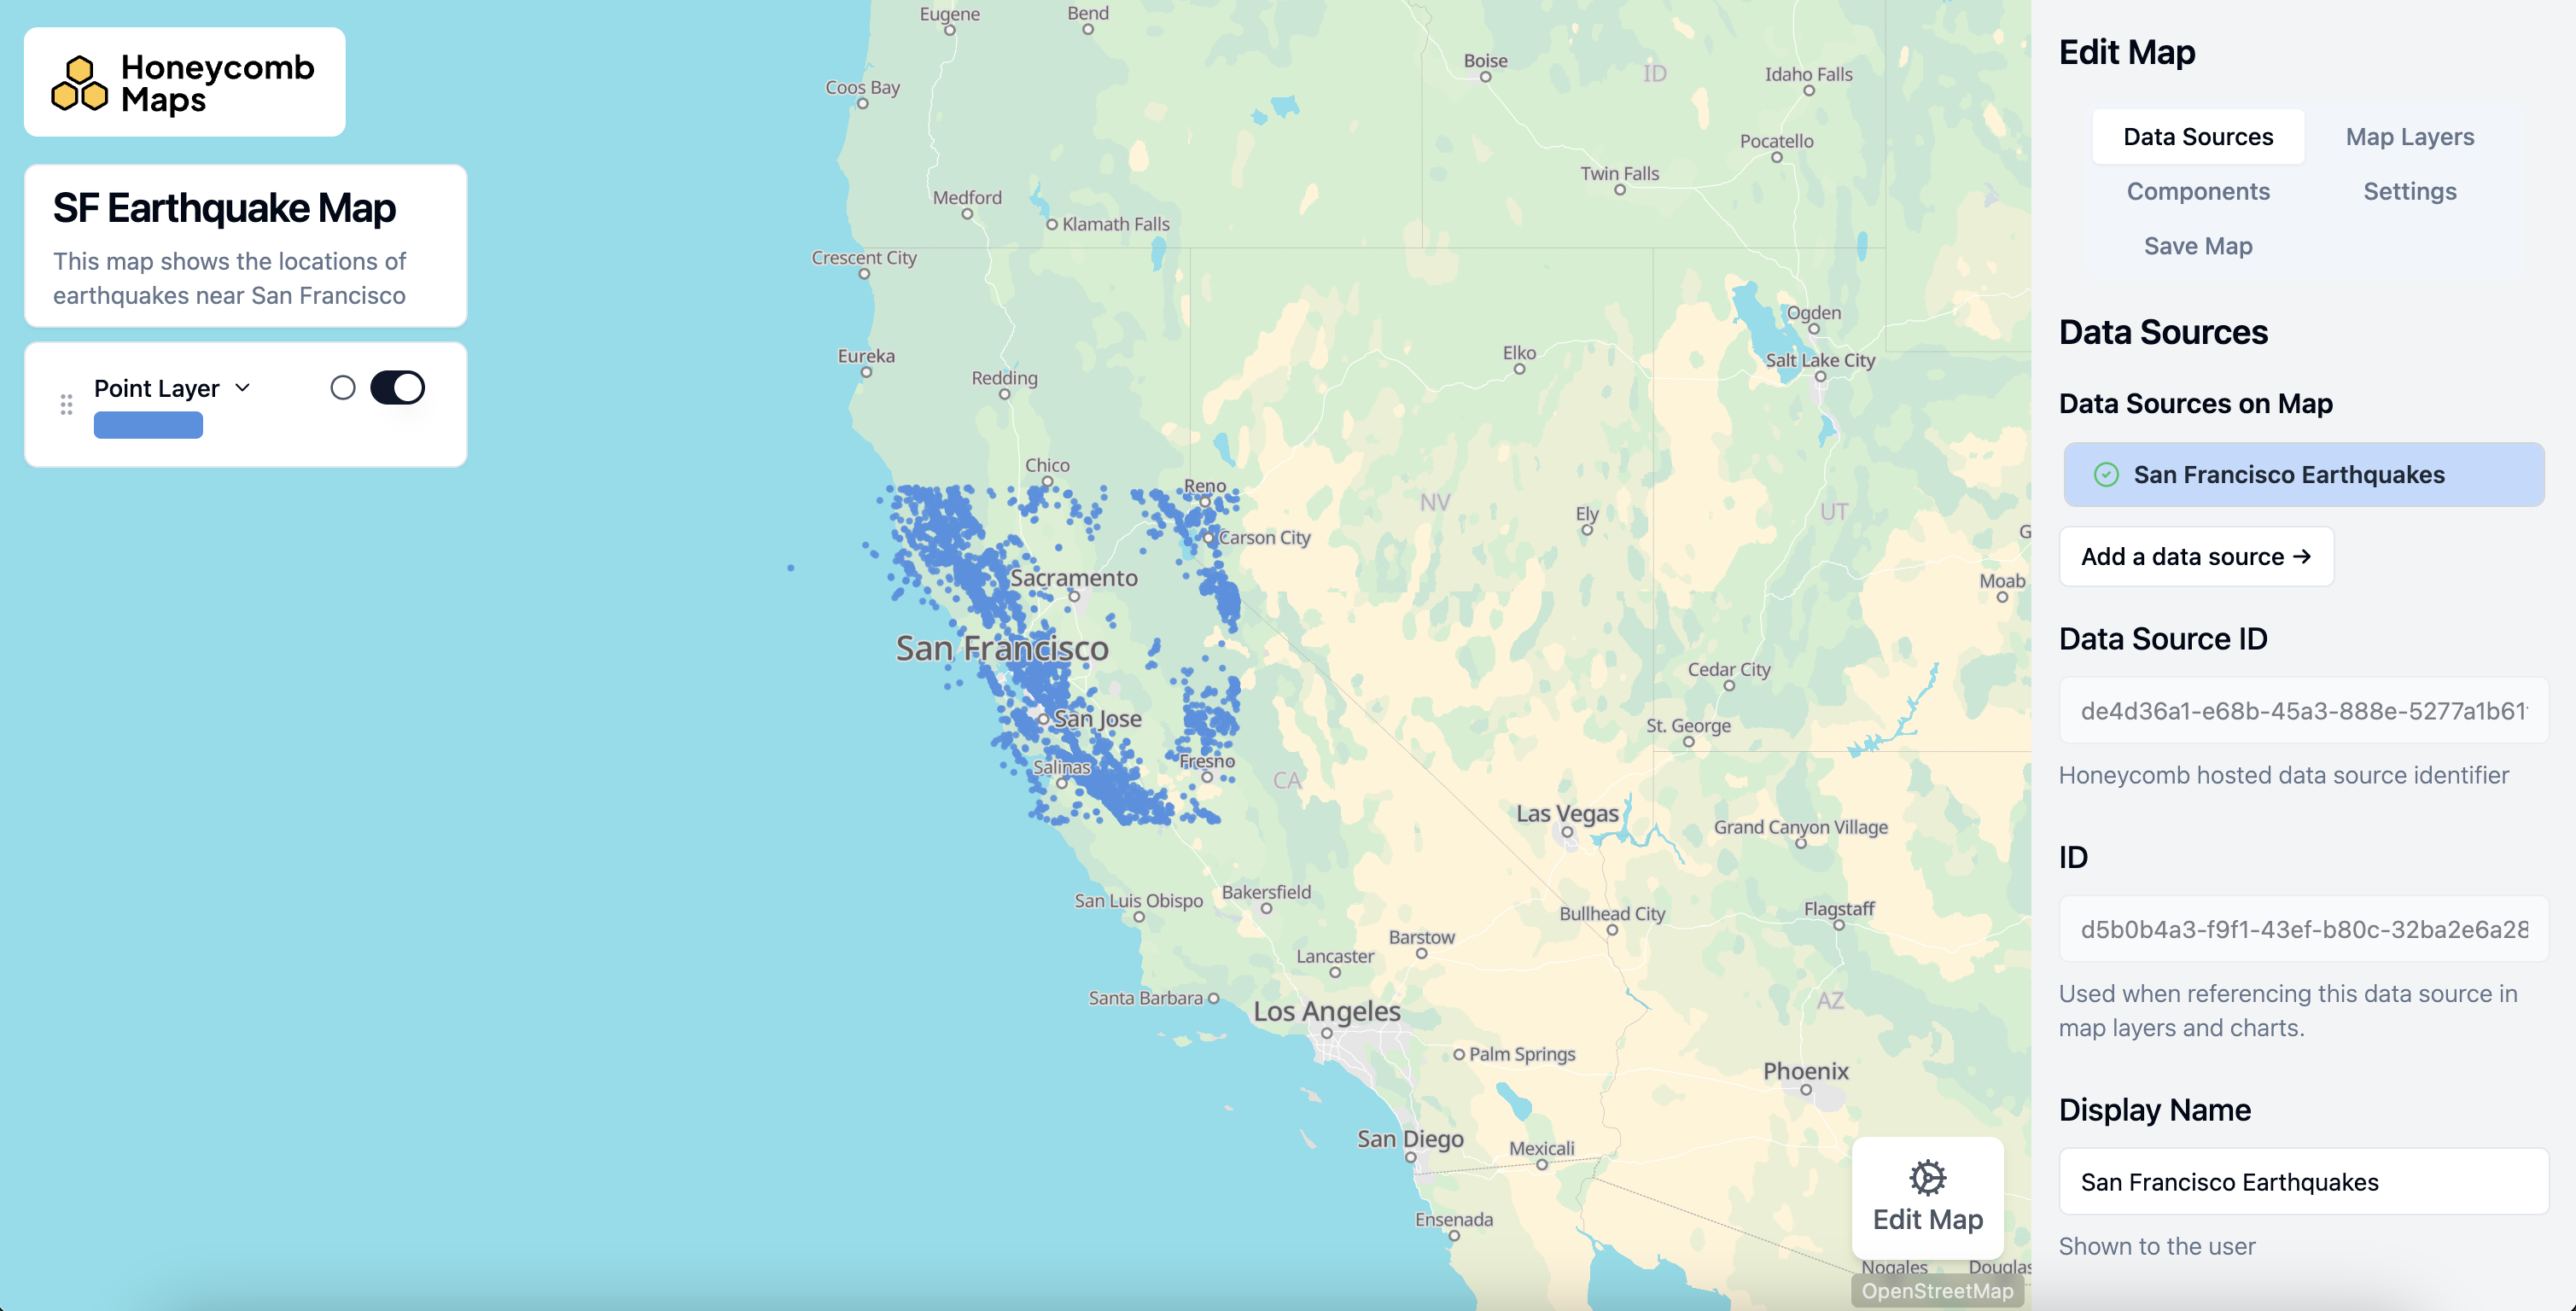
After your data is loaded, the map will display your data using a default point layer. Open the Data Sources tab to review your connected data, then switch to the Map Layers tab to customize how your data appears on the map.
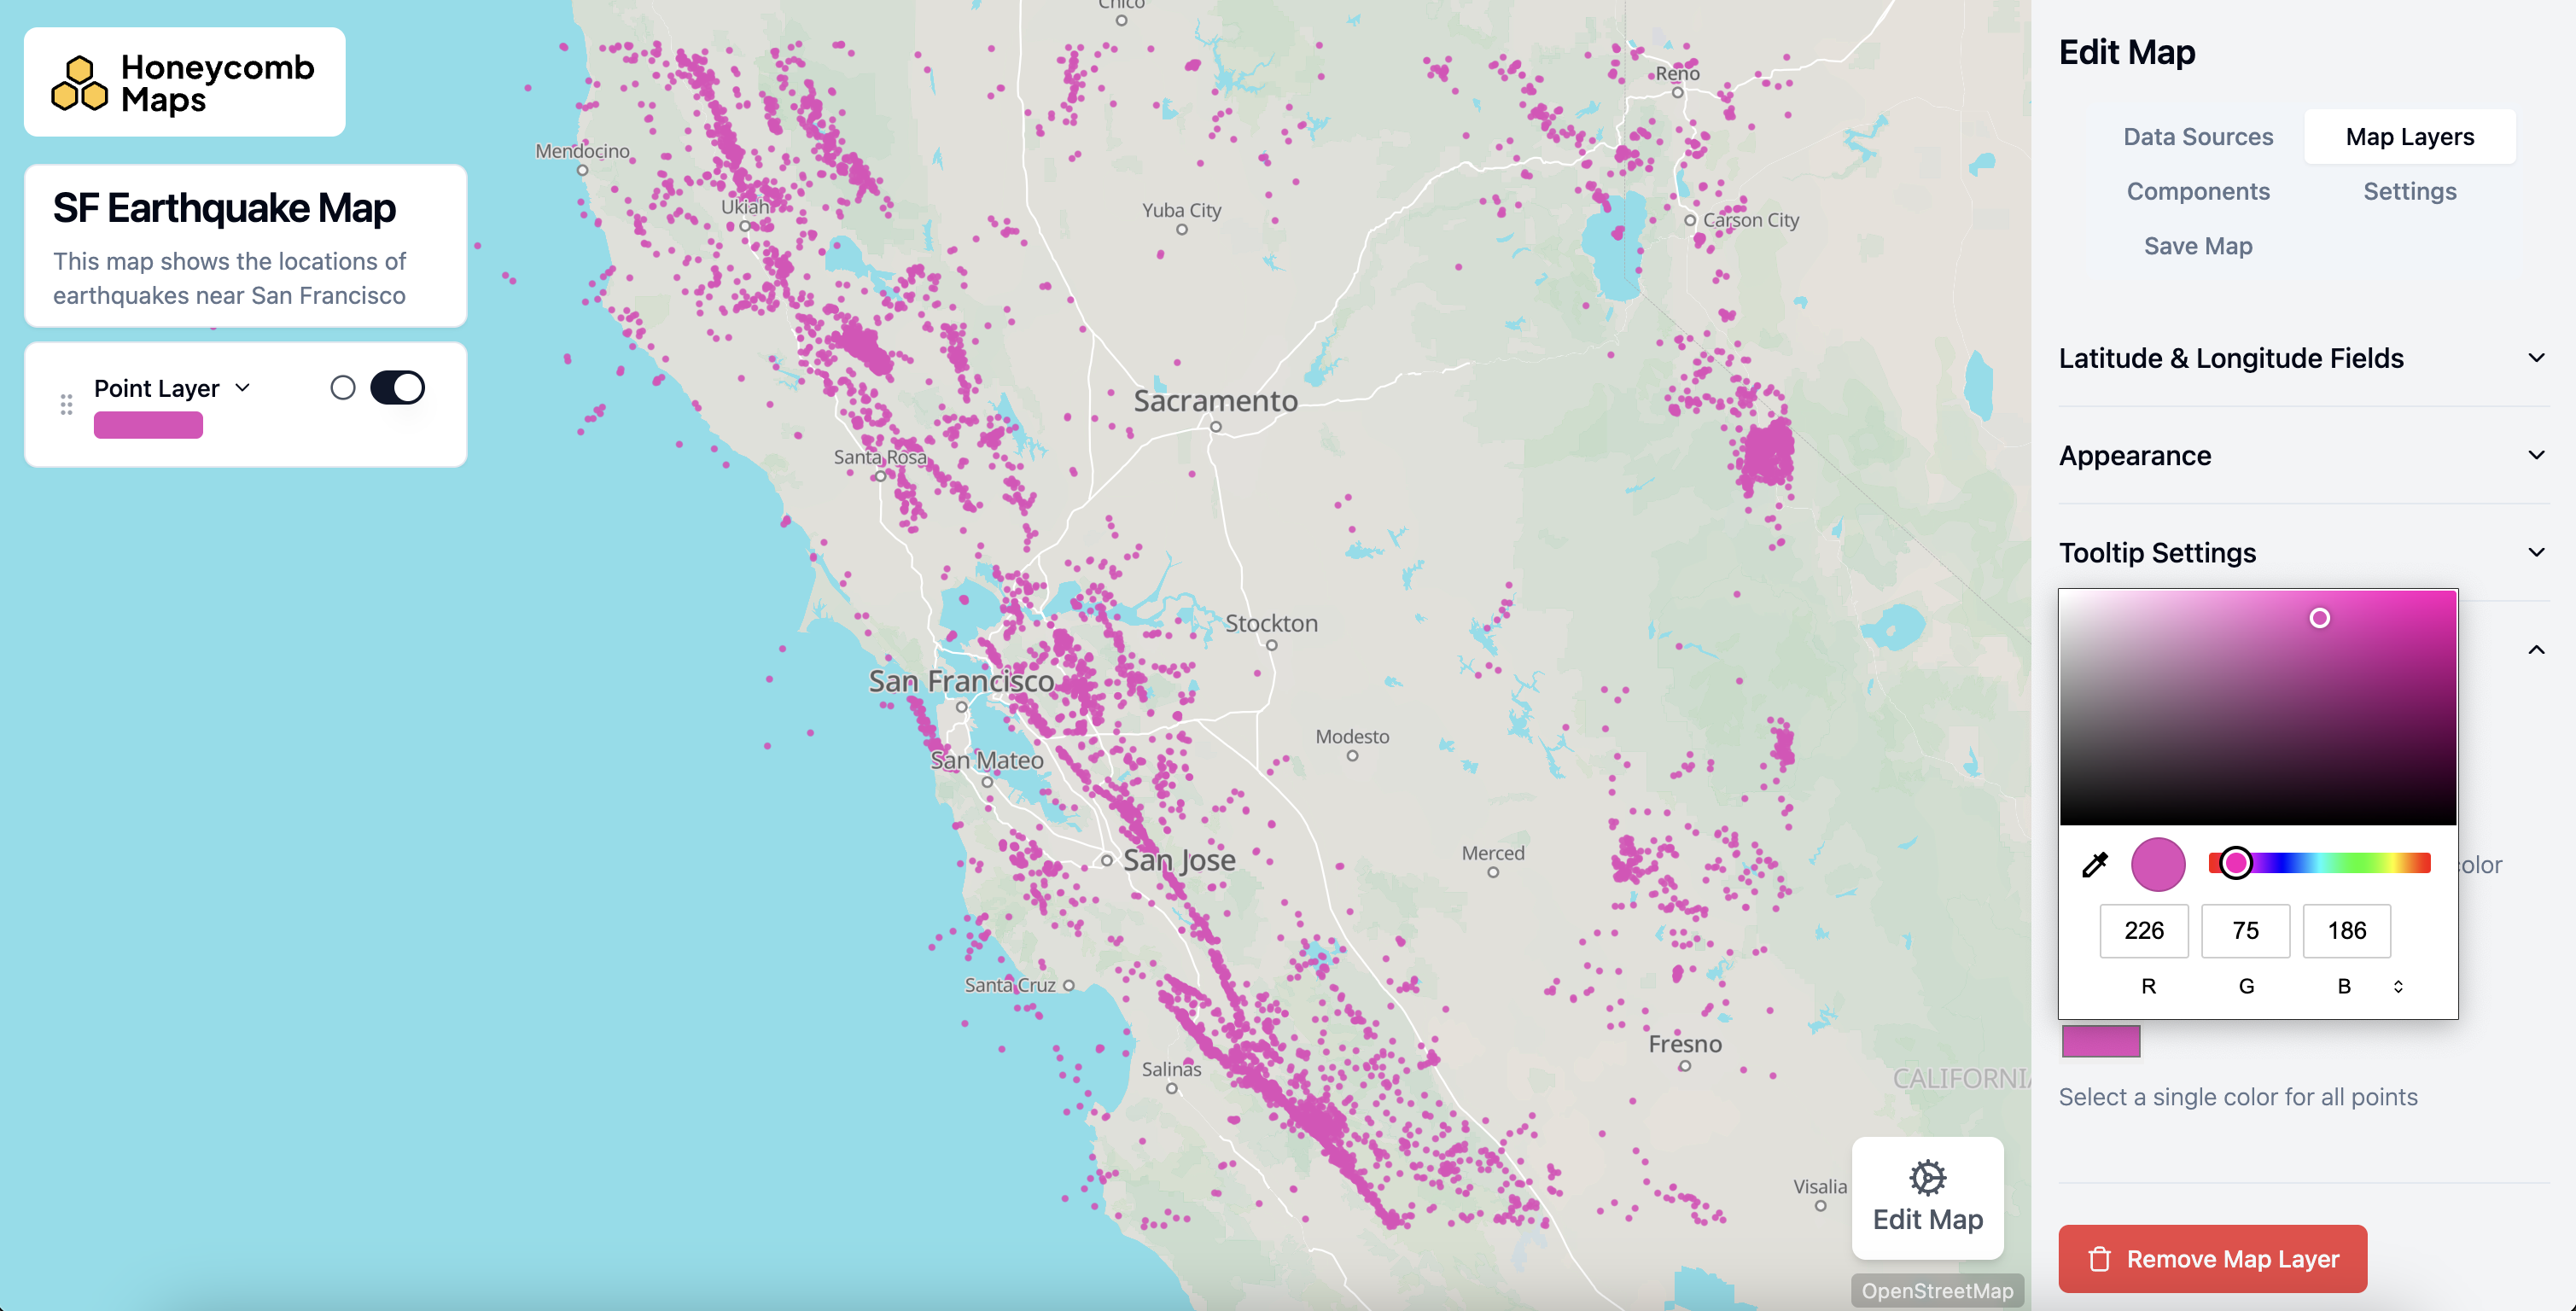
In the Map Layers tab, configure the appearance of your layers. You can adjust colors, sizes, tooltip settings, and choose from point, line, polygon, H3, or arc layer types.
5. Add components
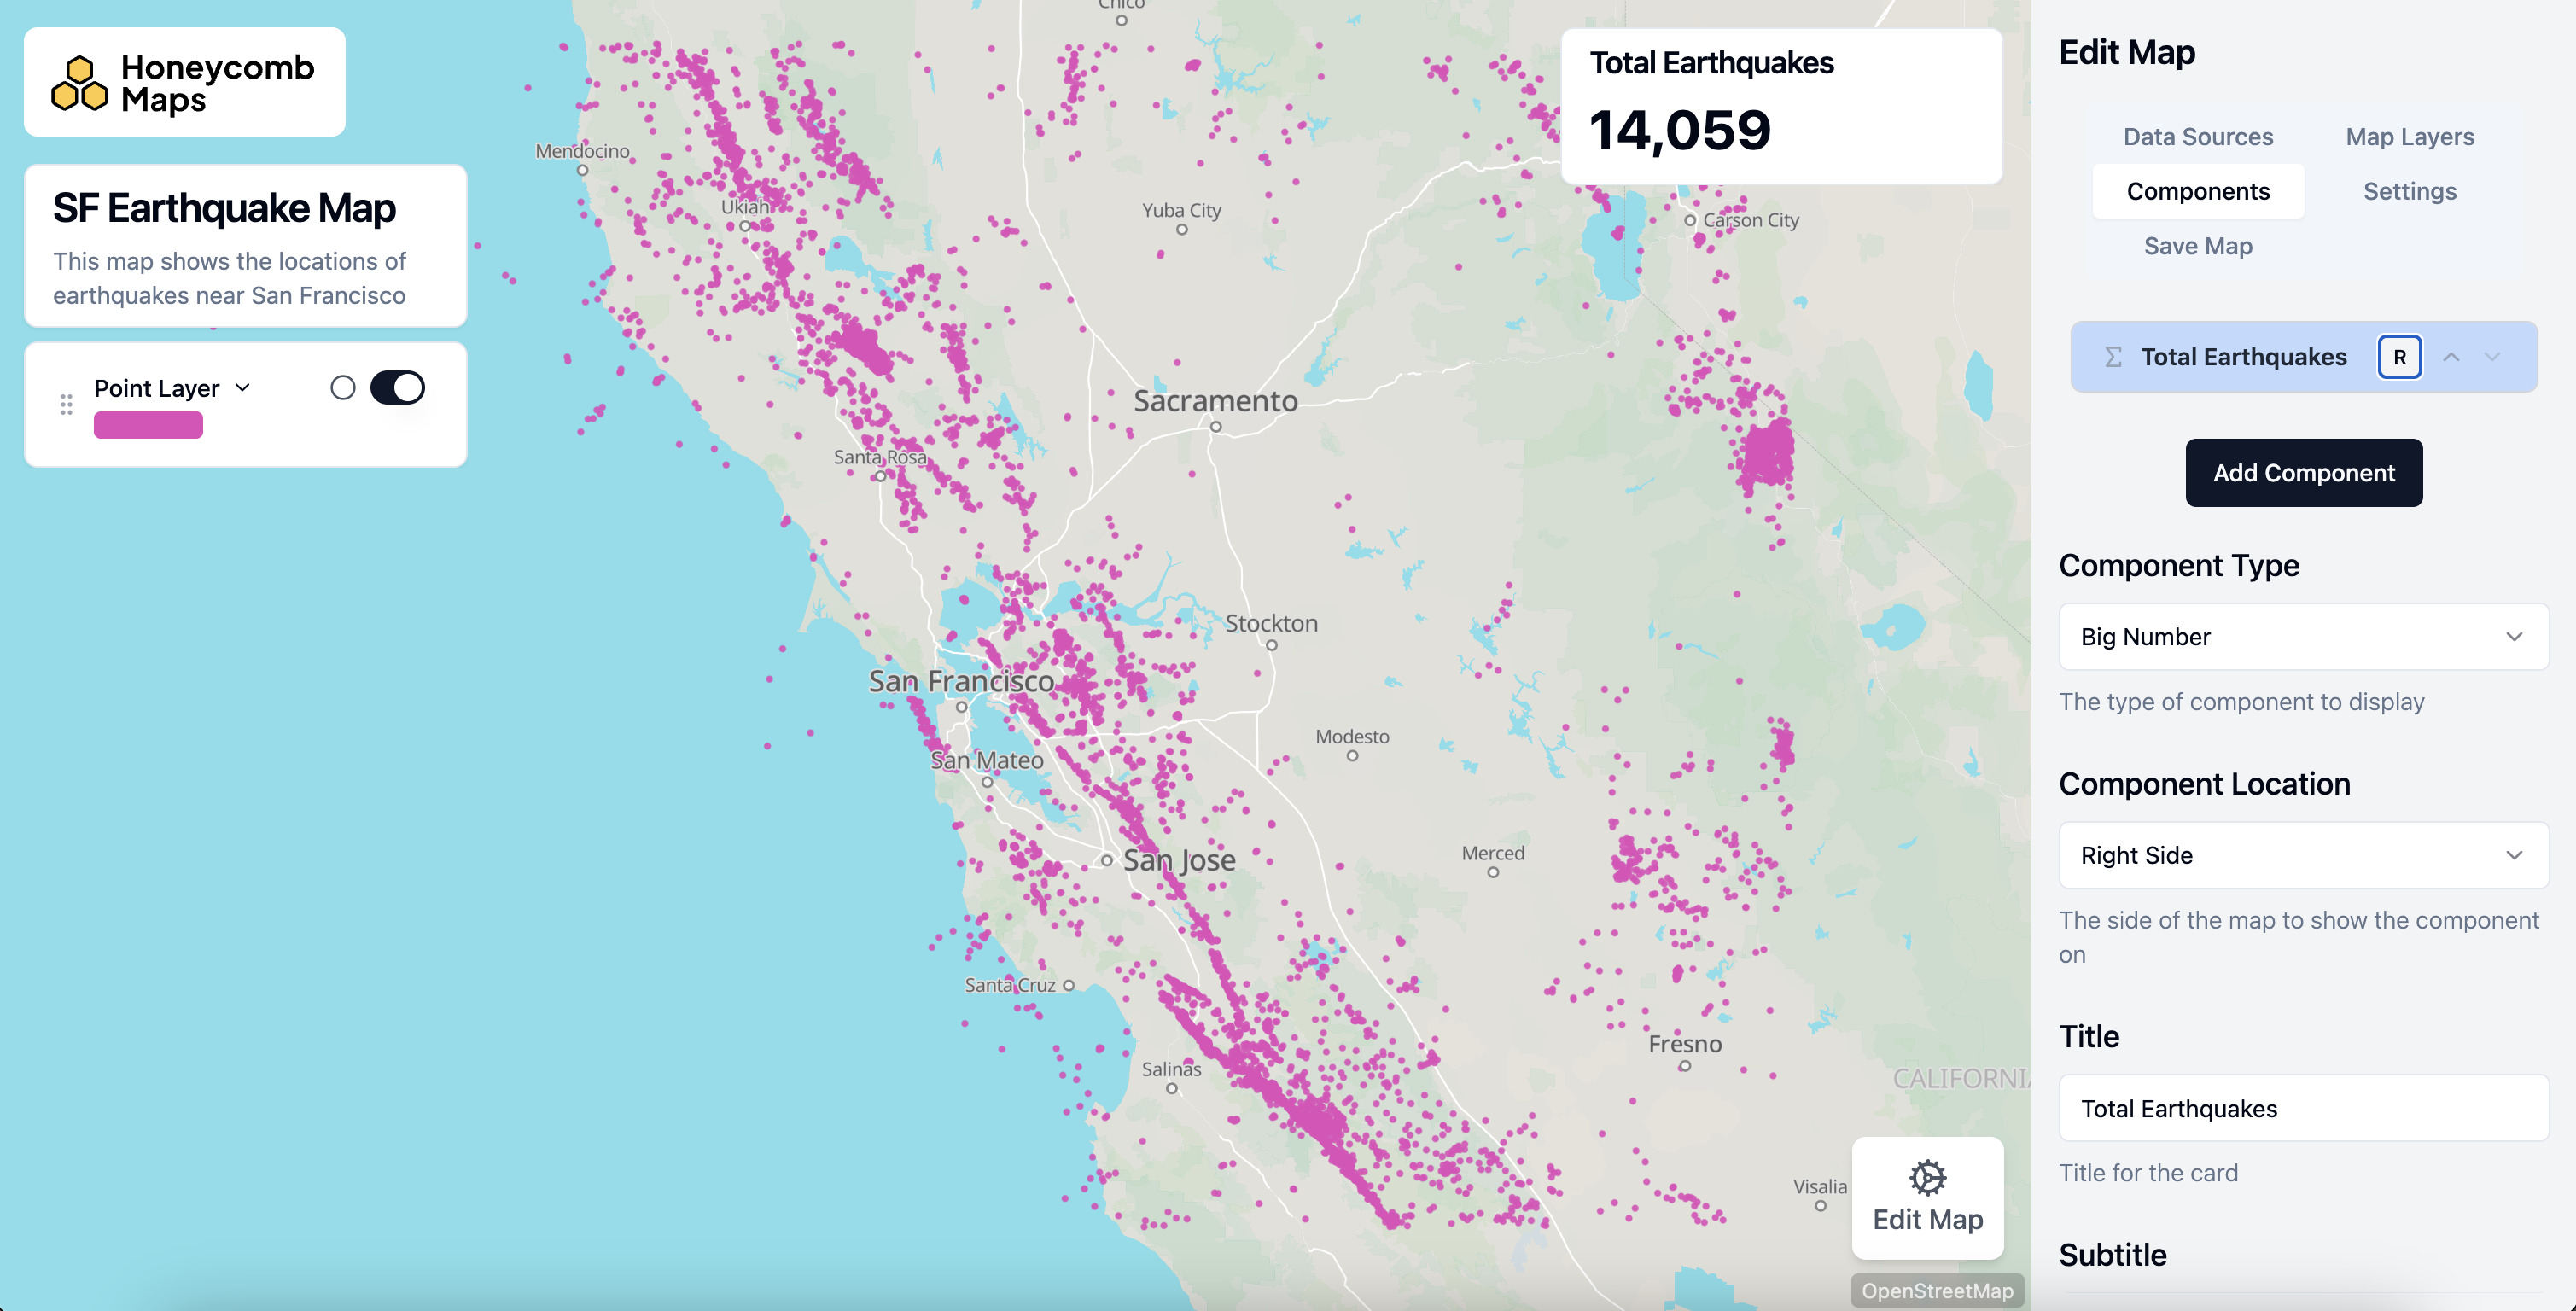
Switch to the Components tab and click Add Component to add interactive elements on top of the map, such as big numbers, charts, filters, legends, and title cards. These help your audience explore and understand the data.
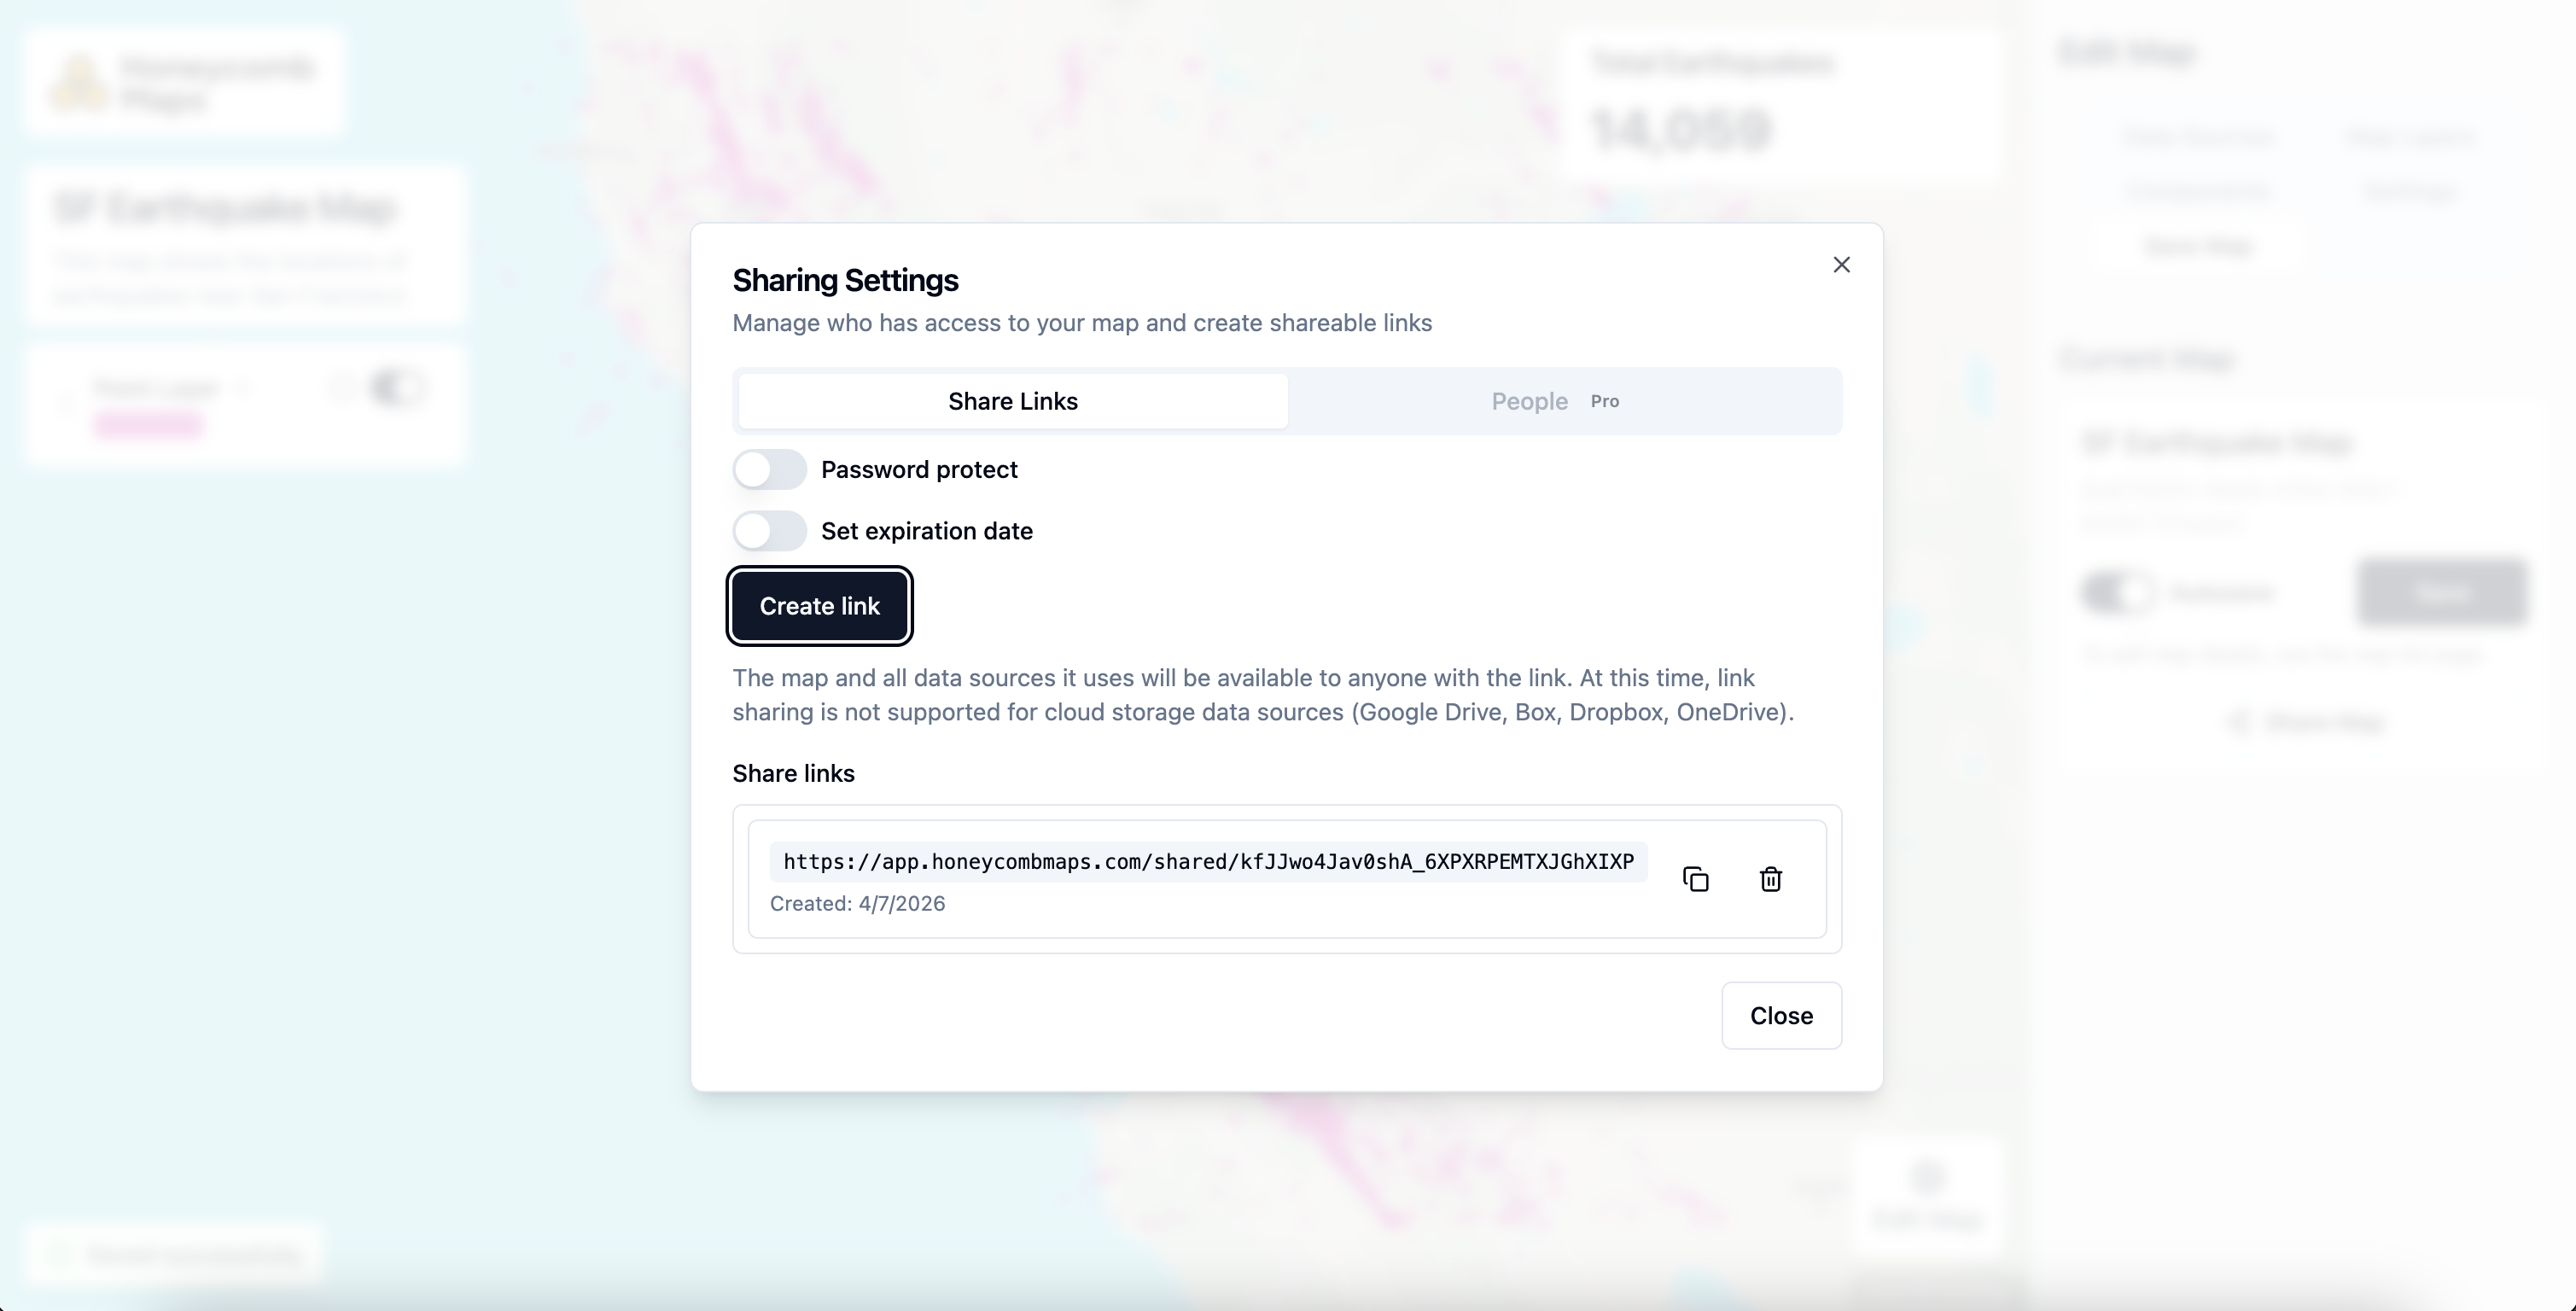
6. Save and share
When you are happy with your map, click Save Map. Then click Share Map to open the Sharing Settings dialog, where you can create a shareable link, set a password, or configure an expiration date.
Try it out
View the map created in this quickstart: SF Earthquake Map
Next steps
- Building Maps - Learn how to structure data, style layers, and add components
- Feature Reference - Detailed documentation for every layer type and component
- Key Concepts - Understand how Honeycomb Maps processes data