Legend
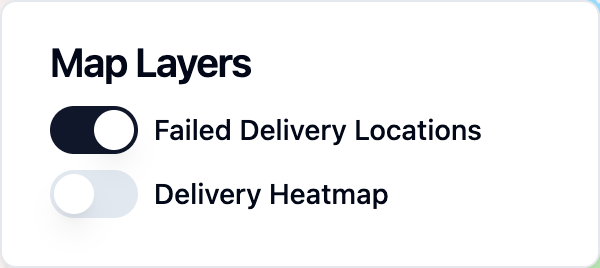
The legend component shows a list of map layers and allows the user to toggle them on and off. For layers that use dynamic styling, the legend also displays keys that explain how data values map to colors and sizes.
All map layers are automatically shown on the legend component.
Example
Layer Keys
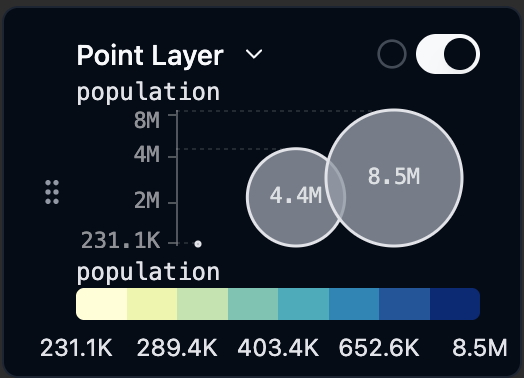
When a layer is styled based on a data field, the legend automatically displays the relevant keys for that layer:
- Color key: Shows the color scale (for continuous fields) or category colors (for categorical fields) and the values they represent. See Color Schemes for how colors are configured.
- Size key: For point layers using a data-driven radius, a series of sized circles shows which radius corresponds to which data value.
- Width key: For line and arc layers using a data-driven width, a series of varying-thickness lines shows which width corresponds to which data value. Line and arc layers share the same width key.
When a layer uses both a data-driven size and a data-driven color, the size key is shown above the color key. See Size Schemes for how sizes are configured.
Configuration Options
The legend component does not have any configuration options. Keys appear automatically based on how each layer is styled.