Line Layer
The Line Layer allows you to display linear features on the map, such as routes, roads, or boundaries. This is useful for visualizing routes, connections, or geographic features represented by lines.
Data Requirements
The Line Layer requires a data source with a column containing line data in one of the following formats:
- GeoJSON LineString
- Well-Known Text (WKT) LineString
- Snowflake's native
GEOGRAPHYdata type
Example
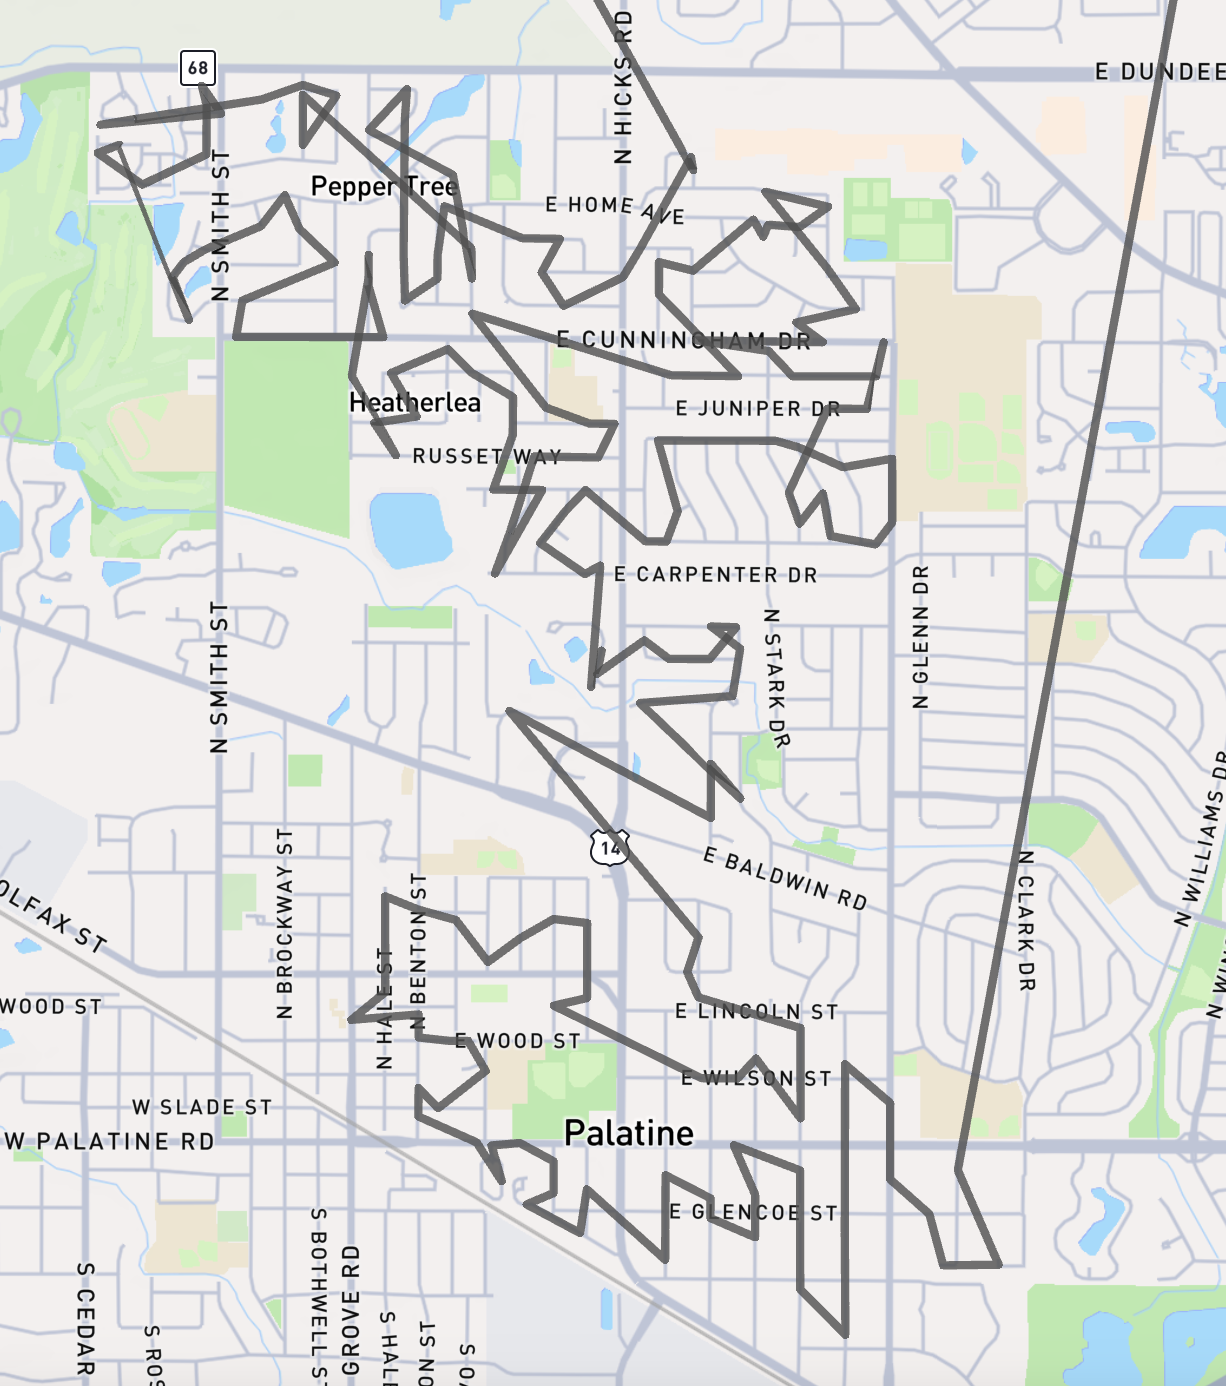
Configuration Options
Basic Properties
- Line Field: The column containing the line data.
- Data Source: The data source to use for the layer.
- Visible: Whether the layer should be visible on the map by default.
- Visible Zoom Range: The zoom levels at which the layer should be visible. This can be used to show detailed line data only when zoomed in.
Appearance
The appearance of the Line Layer can be customized with the following options:
Opacity: The overall opacity of the lines.
Size Mode
- Single Size: Use a fixed width for all lines. Set the width and choose whether it is measured in meters (scales with zoom) or pixels (constant on screen).
- Data-Driven Size: Vary line width based on a data field.
- Size Field: The field that determines line width.
- For a numeric field, set a Minimum Width and Maximum Width and choose an Interpolation Type (linear, square root, logarithmic, or custom discrete).
- For a categorical field, map each category to a width.
Minimum Pixels / Maximum Pixels: Clamp the on-screen width so lines stay visible without overwhelming the map as the user zooms. Especially useful with meter-based widths.
For complete details on these options, see the Size Schemes documentation.
Interaction
- Tooltips: Enables displaying additional information in a tooltip when the user hovers over a line.
- Tooltip Fields: Select which fields to include in the tooltip.
- Tooltip Number Formatting: Numeric values displayed in tooltips can be formatted for better readability. Apply currency, percentage, or compact formatting, add unit labels, and configure decimal places. See Number Formatting for details.
Colors
The color of the lines can be set to a single color, or dynamically based on a color scheme.
Color Mode
- Single Color: Use the same color for all lines.
- Color: The color to use for all lines.
- Color Scheme: Assign colors to lines based on a data field.
- Color Field: The field to base the color on. Can be a categorical or continuous field.
- Color Scheme: Predefined color schemes to choose from.
- Color Steps: The number of color steps in the scheme.
- Reverse Colors: Reverse the order of colors in the scheme.
- Interpolation Type: For continuous color fields, choose how to distribute colors across your data:
- Value: Colors are distributed evenly across the full range of values
- Quantile: Values are bucketed into equal size groups, then each group is assigned a color
- Custom Discrete: Define your own value ranges and assign specific colors to each range
- Single Color: Use the same color for all lines.
Color Mapping: For categorical color fields, you can customize the color for each category by clicking on the color square.
For detailed information about color schemes, including available palettes and configuration options, see the Color Schemes documentation.
Tips
Perfomance is driven by the number of line vertices which are rendered in the current view.
For best performance, simplify complex lines and limit the total number of vertices, especially when using data-driven line width. The Snowflake function ST_SIMPLIFY can be used for this.
Consider using the 'Visible Zoom Range' to only show detailed lines when zoomed in.
Adjust the 'Minimum Pixels' setting to ensure lines remain visible when zoomed out.
Choose colors that provide good contrast against the basemap, especially for thin lines.